Calculated items
You can now use calculations in board. These are more powerful and easier to use then calculated items.
Calculated items are deprecated.
Welcome to this guide on setting up calculated items. If you'd like to learn more about them, you can also check out the calculated items reference in the admin panel.
With calculated items you can create new items that transforms the content of your existing items. This allows you to solve cases like adding together multiple time series or multiplying a time series with a constant to convert it.
In this guide we will walk you through the steps required to set up your own calculated item.
Only administrators of an organization can create calculated items, if you do not currently have access, please contact your organization administrator.
Getting started
In our example, we will see how we can combine two items that tells us something separately, into one item that brings more knowledge to our organization. We have set up integrations with our power meter, as well as a query to fetch the prices for electricity.
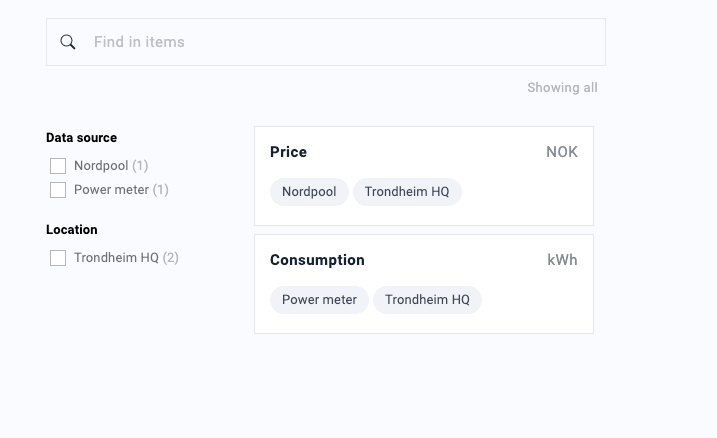
This lets us see how much power we are currently using, as well as how much each unit of power costs. We can even set up a timeline that shows both at the same time.
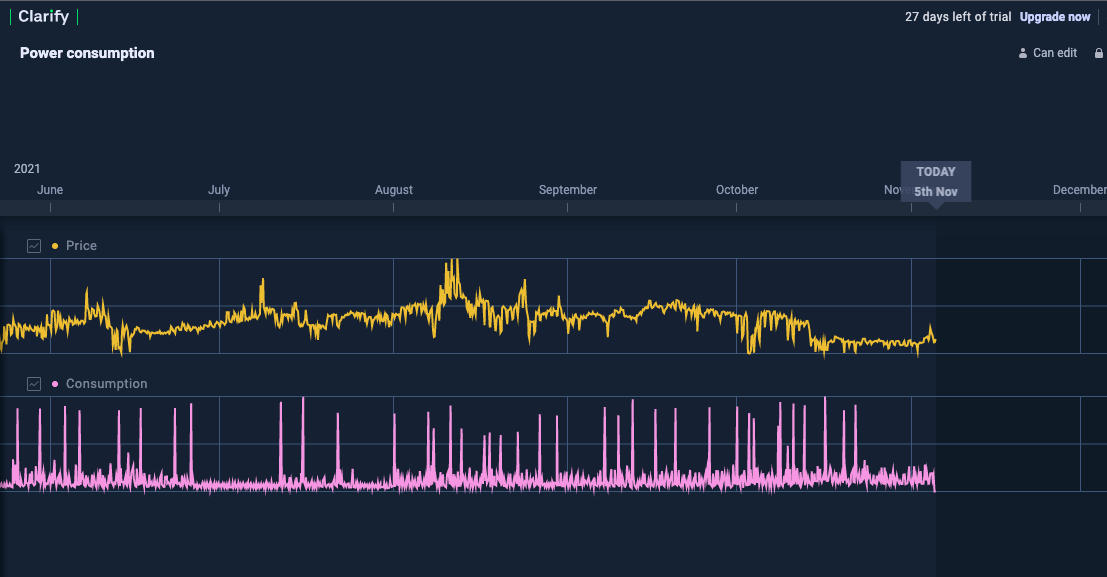
What we can't tell, is how much we are paying for the amount of power we are using at any given time, but this we can easily fix with calculated items! Let's start by heading into the admin panel of our organization.
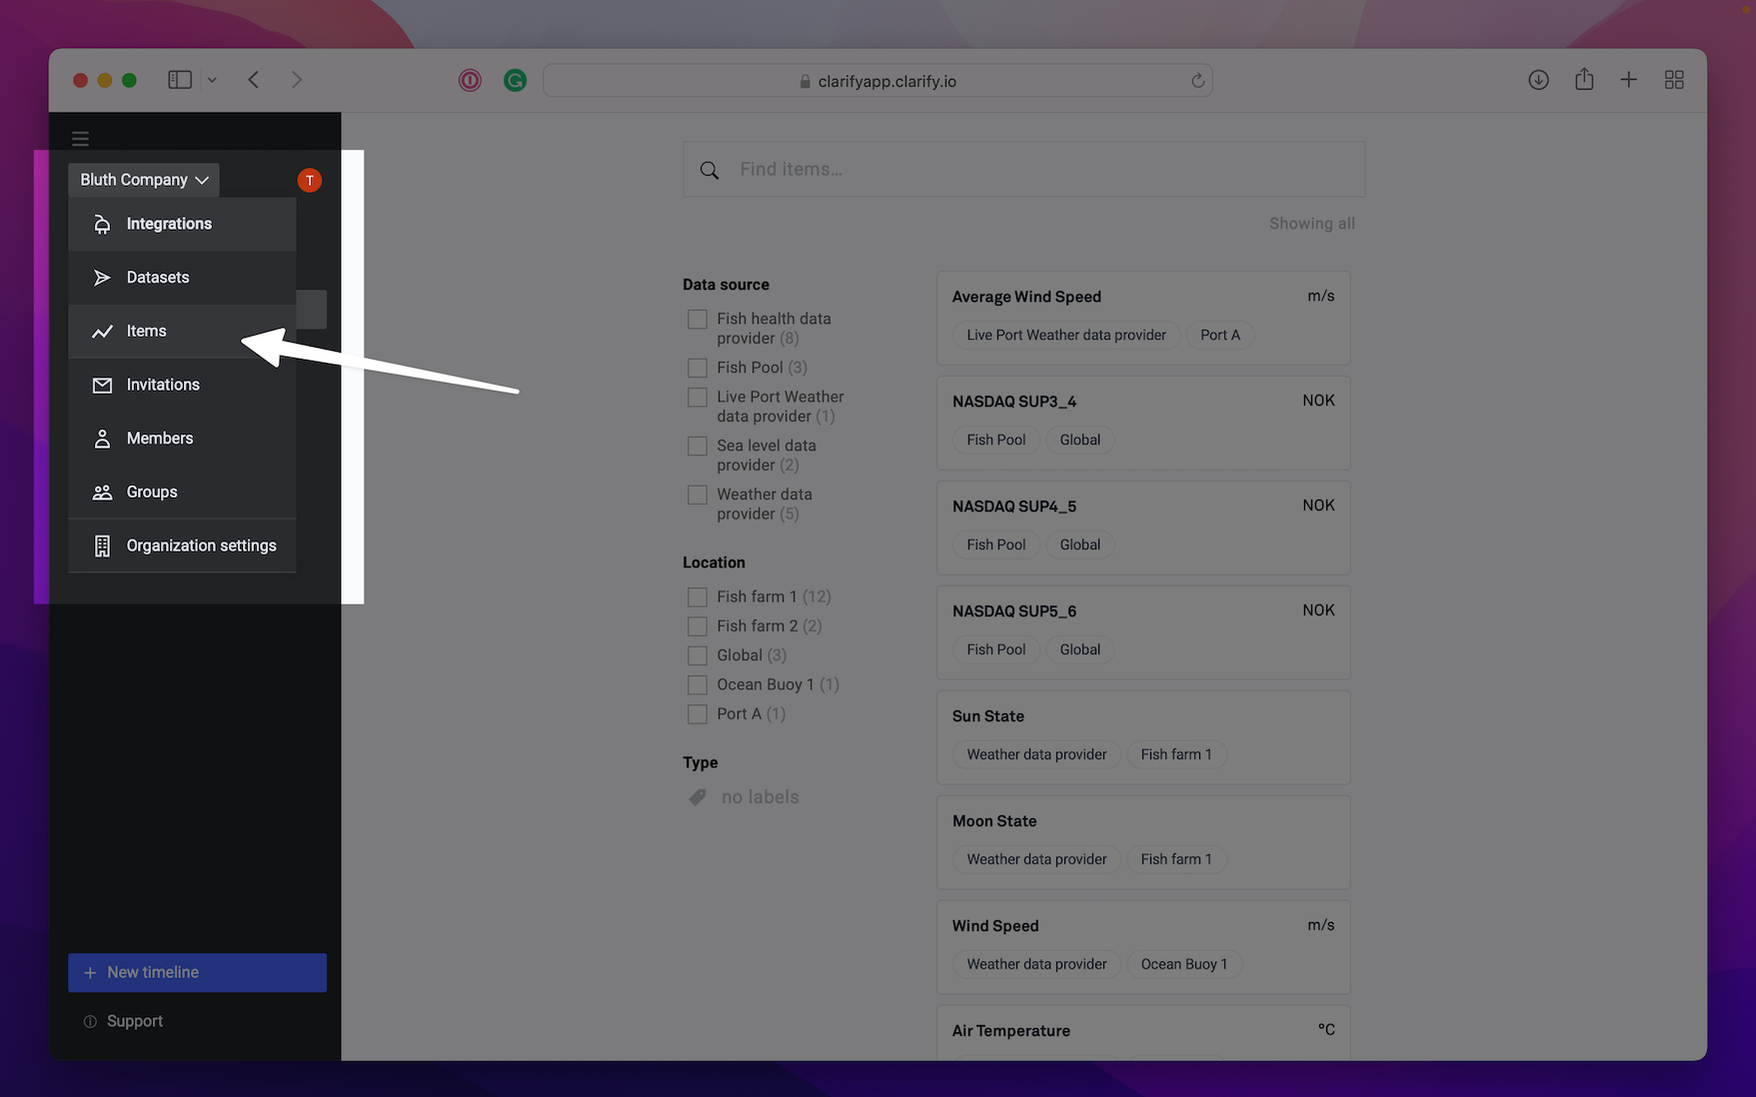
Create a calculated item
Once we are in the panel, we can create a new calculated item by pressing the "+ Add" button besides "Variables".
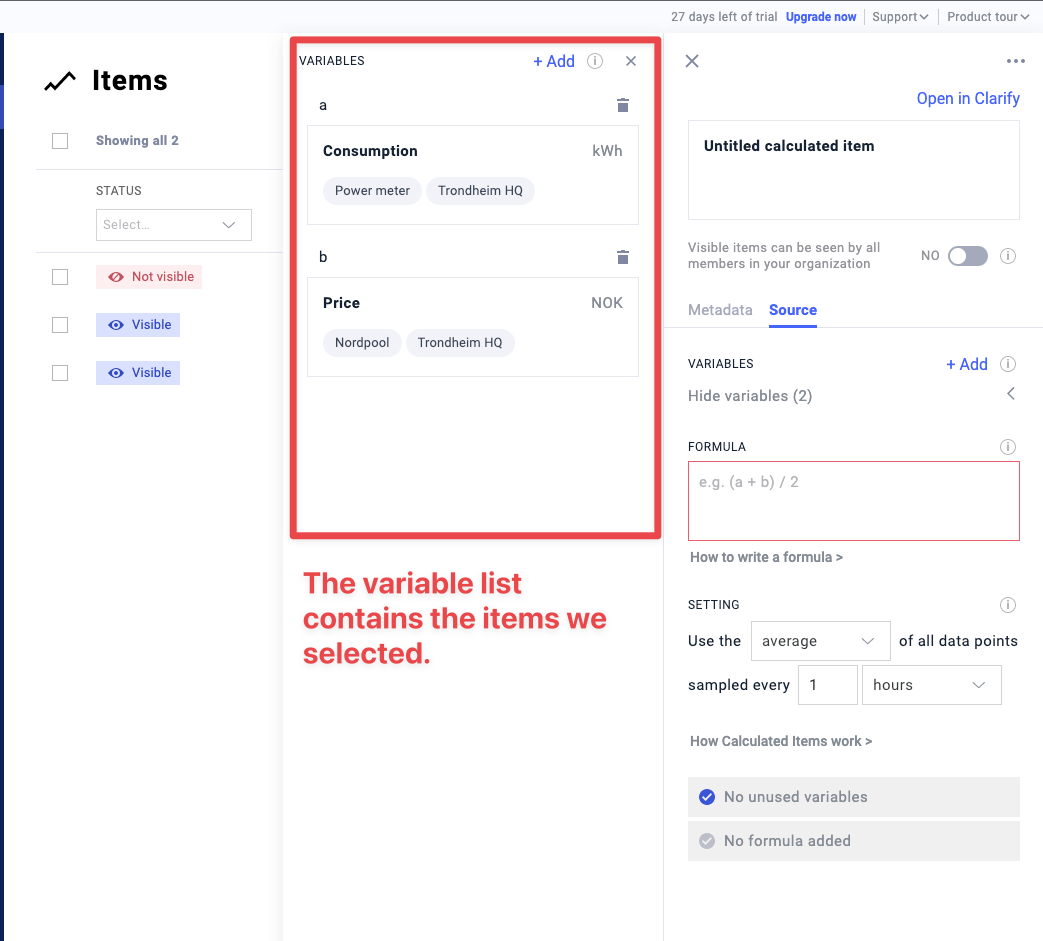
What we have now is an empty calculated item, we will need to define a few things here in order to perform the calculation, as well as setting some meta data to make it easy for us and our colleagues to understand what data the item contains.
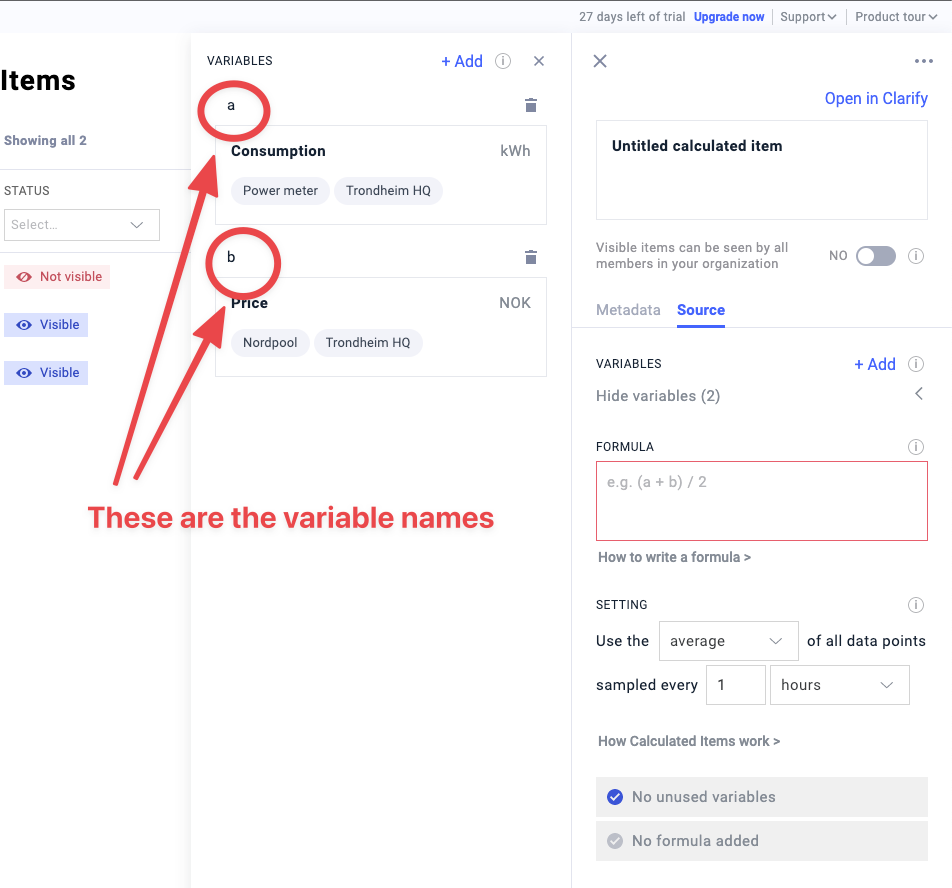
When creating these calculations, we start by picking the items that we want to use in our calculation, or the variables of our calculation.

Notice that in the list of our variables, the items we chose has gotten assigned some variable names. The consumption is named a and the price is named b. What we want to achieve here is to calculate the cost of the power that we are consuming, which we can get by multiplying the consumption with the electricity price.
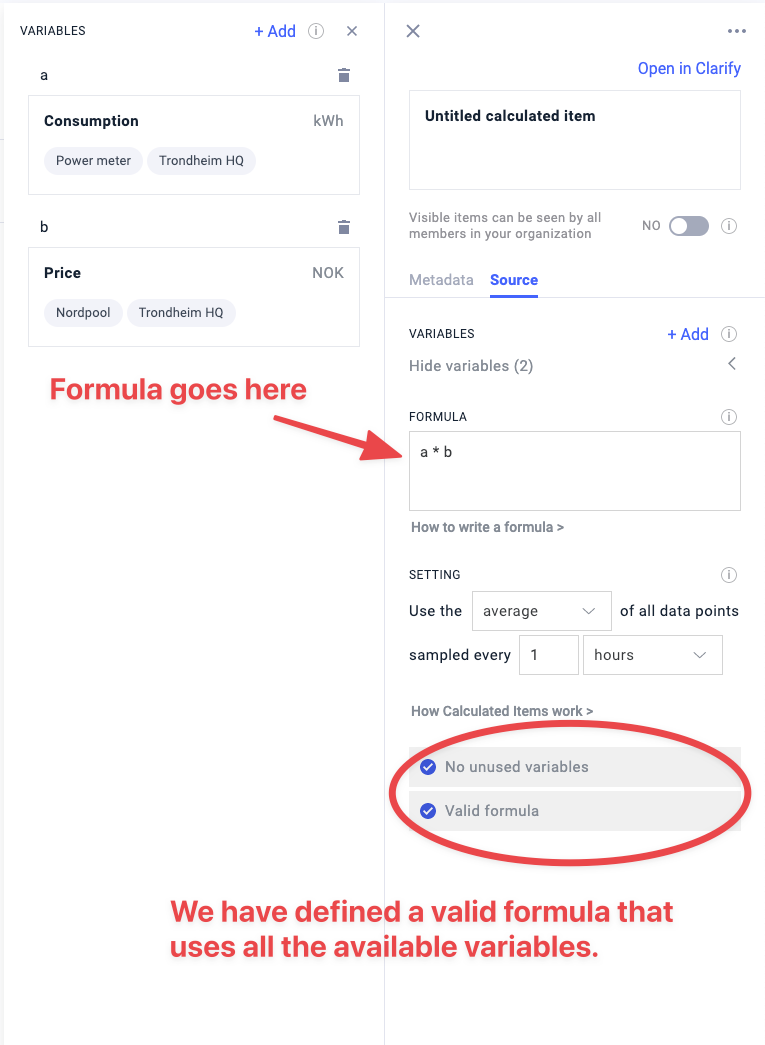
To set up the formula, we use the variable names and enter in our formula a * b. You'll note that the checkboxes at the bottom of the calculated item are both blue, because we have defined a valid formula that contains all the variables in the list.
If you want to know more about formulas and how they are defined, you can find more details in the reference guide for formulas.
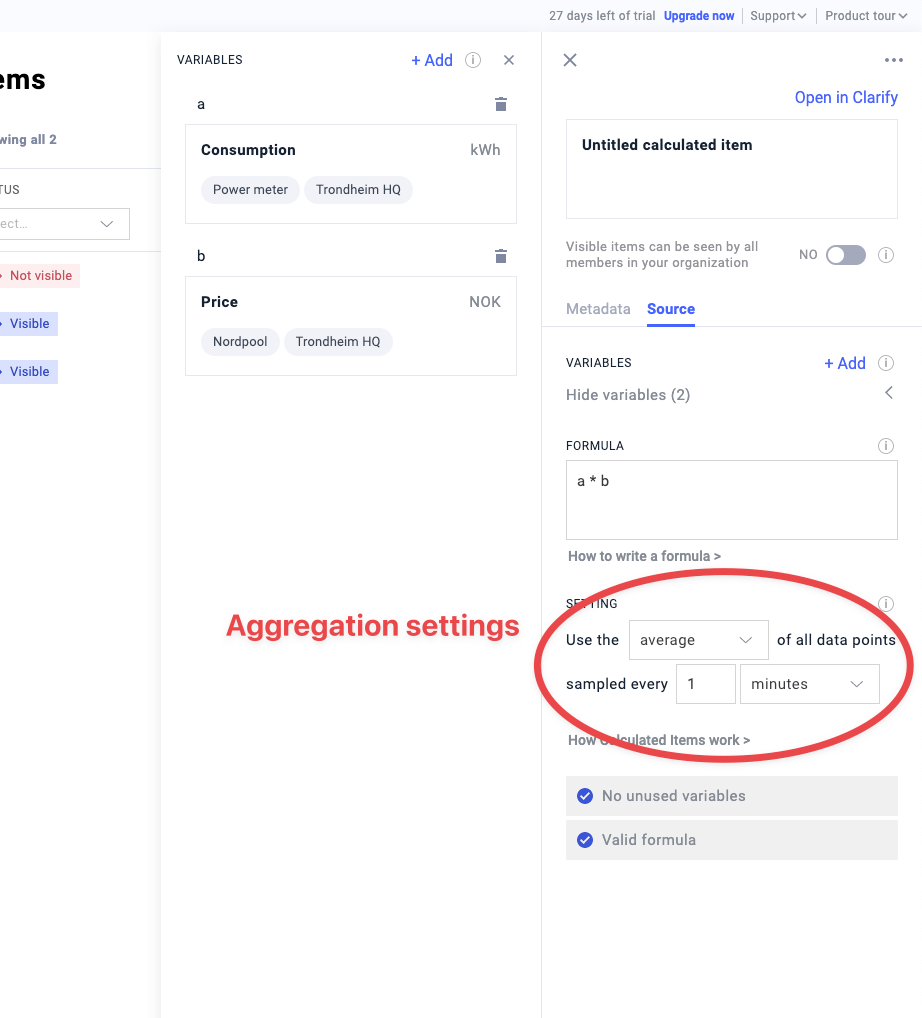
Before saving the formula, we will define one last thing, which is the aggregation setting for the calculation. This section tells Clarify how to ensure that data that might have different sample times can be used in the same calculation. In this guide we won't go into detail on how this works, instead, we'll just set it to "average of all data points, sampled every 1 minute", you can find a detailed explanation of how this works in the reference guide.
For a detailed description of aggregation settings, why they are necessary and how they work, please refer to the reference guide section on aggregation.
Setting up the metadata
Now that we have a valid calculation, we will go ahead and save it before moving into the metadata tab. Here we will give the item a name and define the system labels. This will make it possible both for ourselves, and our colleagues, to easily understand what the item is.
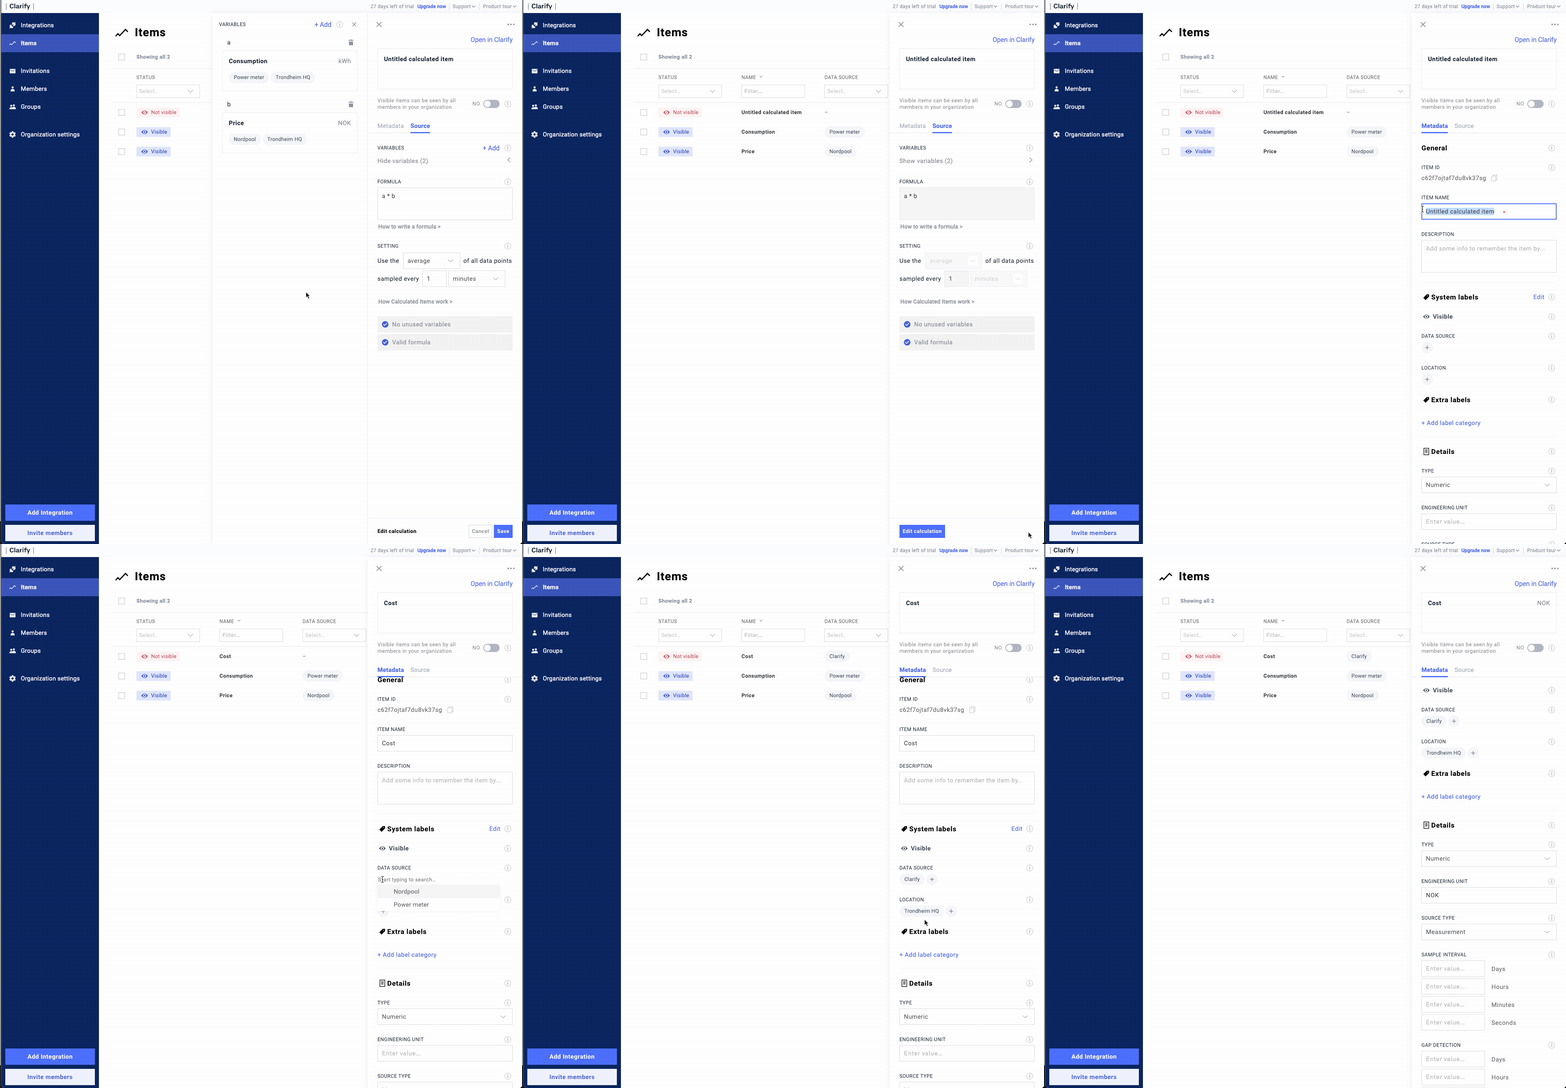
The final step is to make the item visible to others, this is done by toggling the visibility selector on the top part of the item.
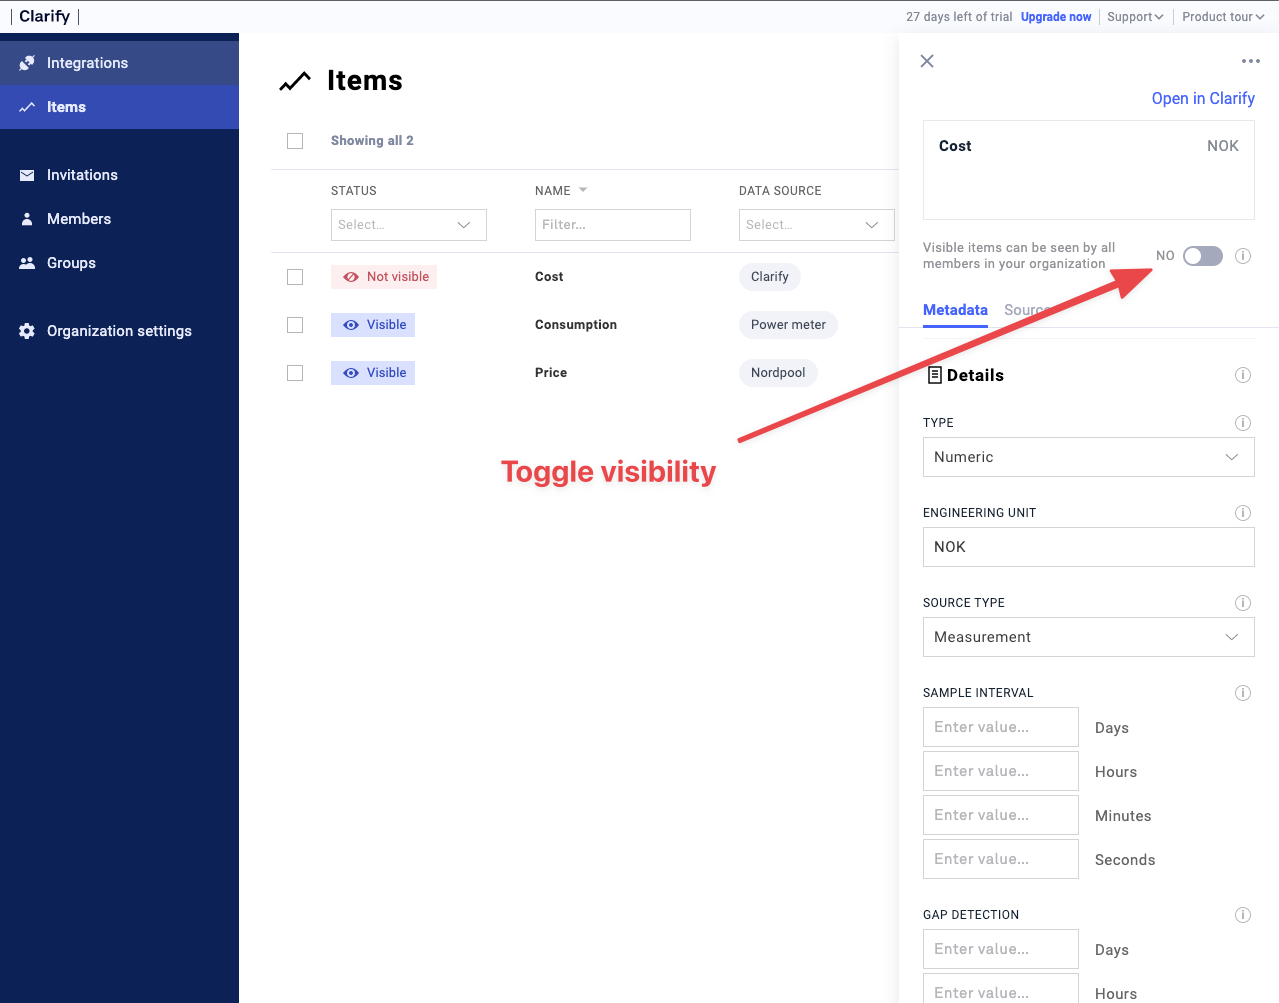
When this is done, you should see the item status in the list change from "Not visible" in a red color to "Visible" in blue.
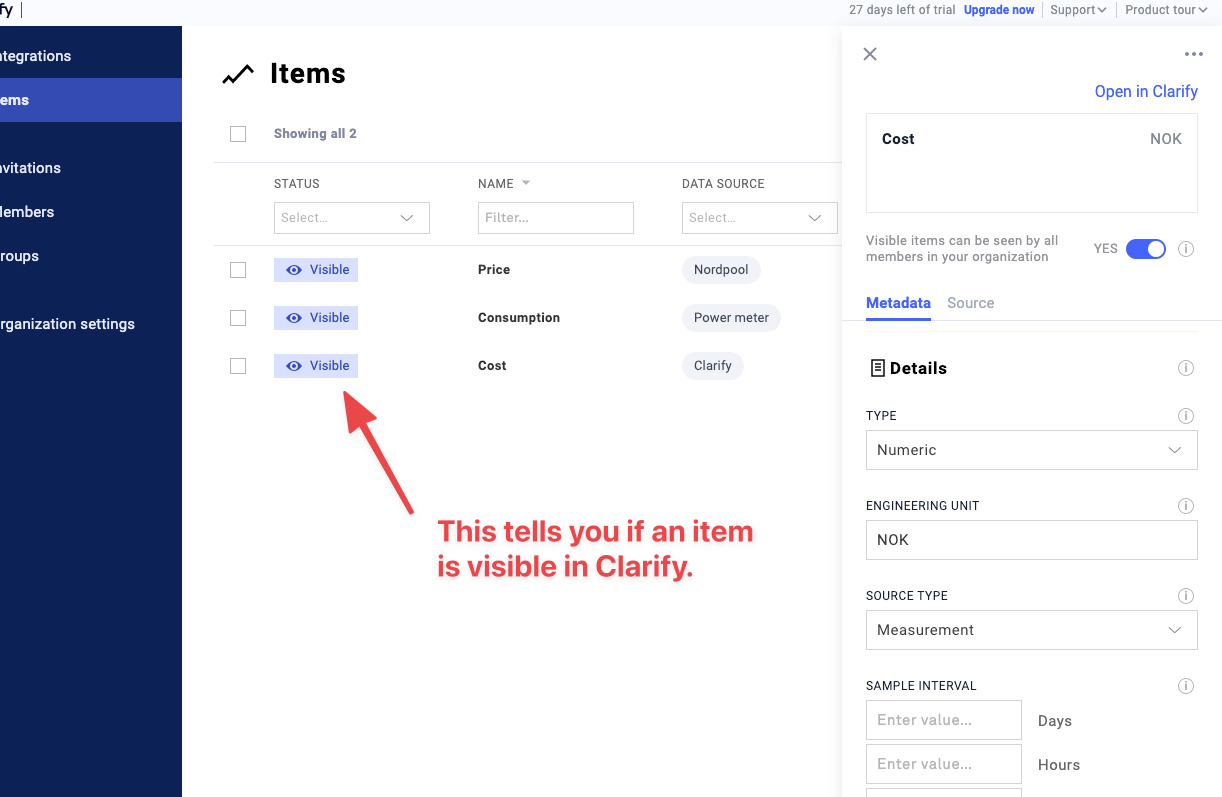
The option to leave an item "Not visible" allows us to temporarily hide items from users, for example while we are editing an item calculation.
Seeing the result
Now we are finally ready to look at the result of our calculation. We'll head back to the timeline we created with the items for price and consumption and add our newly created item to it to see the data.
You'll notice our calculated item shows up in the list of available items now and we can simply drag it into the timeline with the others.
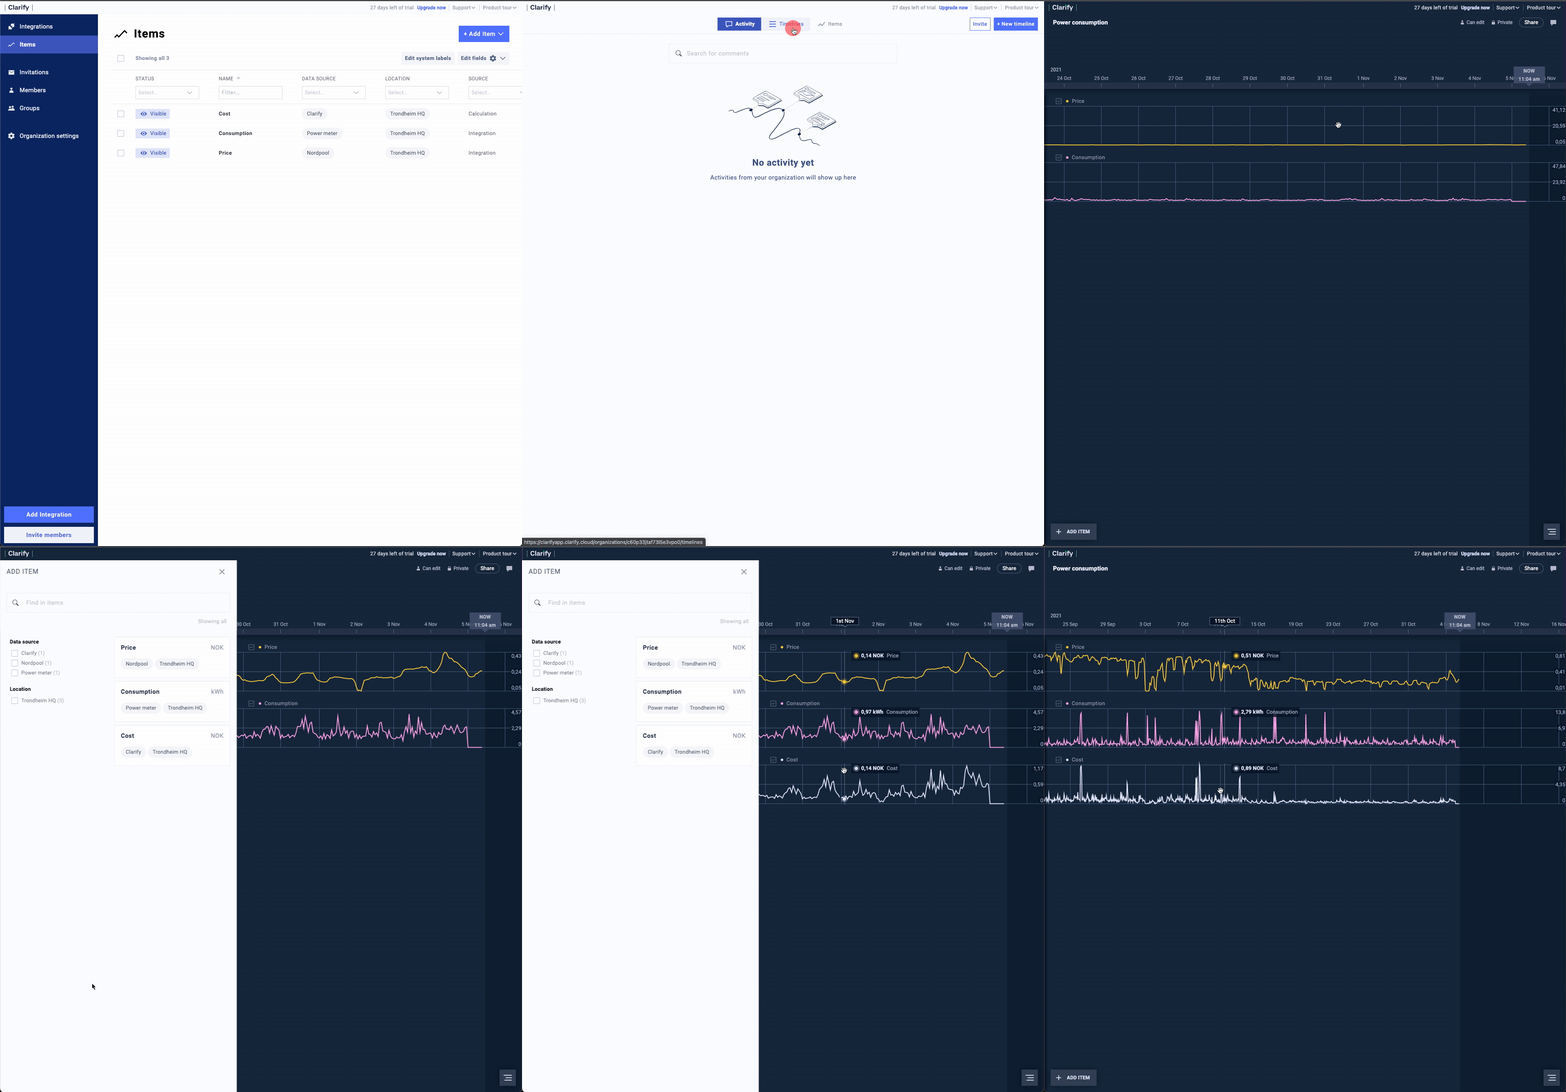
Because of how calculated items are handled in Clarify, when a calculated item is created you will immediately be able to view both new data, as well as historical values.