Understand boards
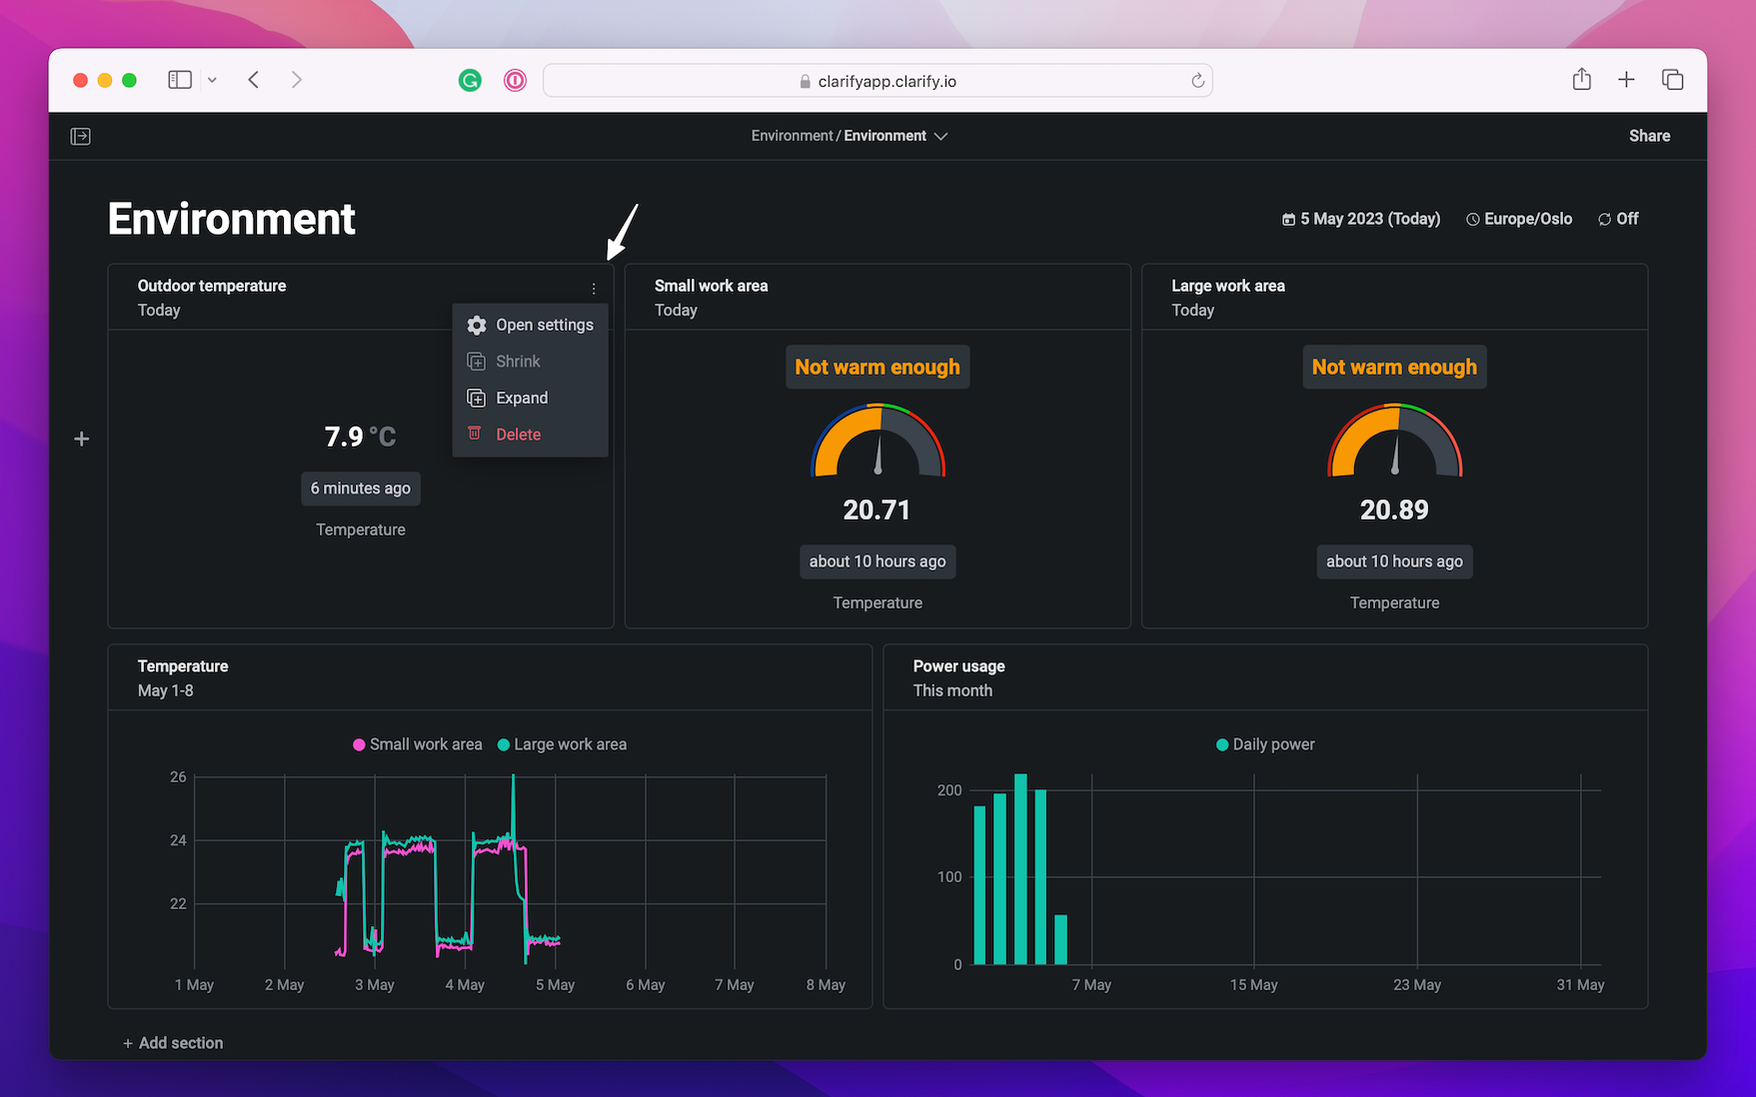
To better understand boards, it is important to know the different part of the board view. Here we'll go through each part of the board, how to change the settings of the board and the visualizations, how to time travel and how to change the order of each visualization.
Settings
The top of the view will show which collection, if any, the board is in as well as the name of the board. If the name is not yet set, users with edit or admin rights can add or change the name.
To open settings press the arrow next to the name and the settings menu will appear. The full settings menu is only available to admins of the board.
- "Move board" will open a list of all collections available in the organization, select one and press "Move" to add current board to that collection.
- "Set start of week" lets the user decide what day the week should start on.
- "Duplicate board" and "Delete board" will, as the name says, duplicate and delete the board. Delete is available to all admins and editors of the board, along with organization admins.
On the right side there is a "Share"-button, visible to admin and editors of the board. Share the board with others and set their editor role in one go. It is also possible to move the board to another collection, just look at the collection-guide.

Time
The date to the right of the title shows the time settings for the board. Each visualization could have different time ranges, but all is relative to the time setting of the board. If this is changed, then the visualization changes accordingly. The time settings could either be set at a fixed date, or it could be minutes, hours or days in the past or future from todays date. This will let you "time-travel" through your data in your board.
On the left side there is an option to change the time-zone and the auto-update settings. Changing the time-zone might be useful to see the data in the time where it was created. Let's say you are situated in North America and want to look at data from your factory in Europe, viewing the board in the same time zone as it was created in allows you to see when things happened in local time.
Auto-update is turned off by default. If you wish to see the data continuously updated, for example if you want to leave it open on your screen, choose the update interval you want and the board will refresh the data automatically. If you change the time setting of the board, let say you change it to 5 days in the past, change the automated update and the time settings of the board will change to todays date.

Sections
There can be multiple sections in a board. Each section can contain a variation of visualizations such as gauge, single value, timeline or bar chart. Go to the next page to read more about each visualization and how to create one.
After creating the board you might want to change the order of visualizations. This is easily done by drag and drop. Next to visualization name, on the left side there is a square of dots. Press this one to drag the visualization. Remember each section can only hold up to four metrics, two time-series or one time-series and two metrics.
You can also add a new visualizations by pressing the "+ Add section" at the bottom of the last visualization.
Visualization settings
Each visualization can be altered after it was saved to the board. This is done by pressing the three dots on the right side of the visualization header. Here you get the options "Open settings", "Shrink", "Expand" and "Delete" visualization.
