Views
Views in boards makes it possible to use a single board for different locations or assets with similar items.
If you have multiple ships or one or more factories with similar items and you wish to just create one board with one setup for these similar locations, boards with filter and views are the way to go. Here you can create groups of all items for all locations in each visualization, then create views with the corresponding filter to show each location. Lets take a look at how to do this.
Create a visualization with filterable items
First create a board, then a visualization with items. Select those items that show similar values in different locations. In this case we selected the temperature in each of our office rooms. When all items are selected choose "Add group", and all items are created as a group and is filterable.
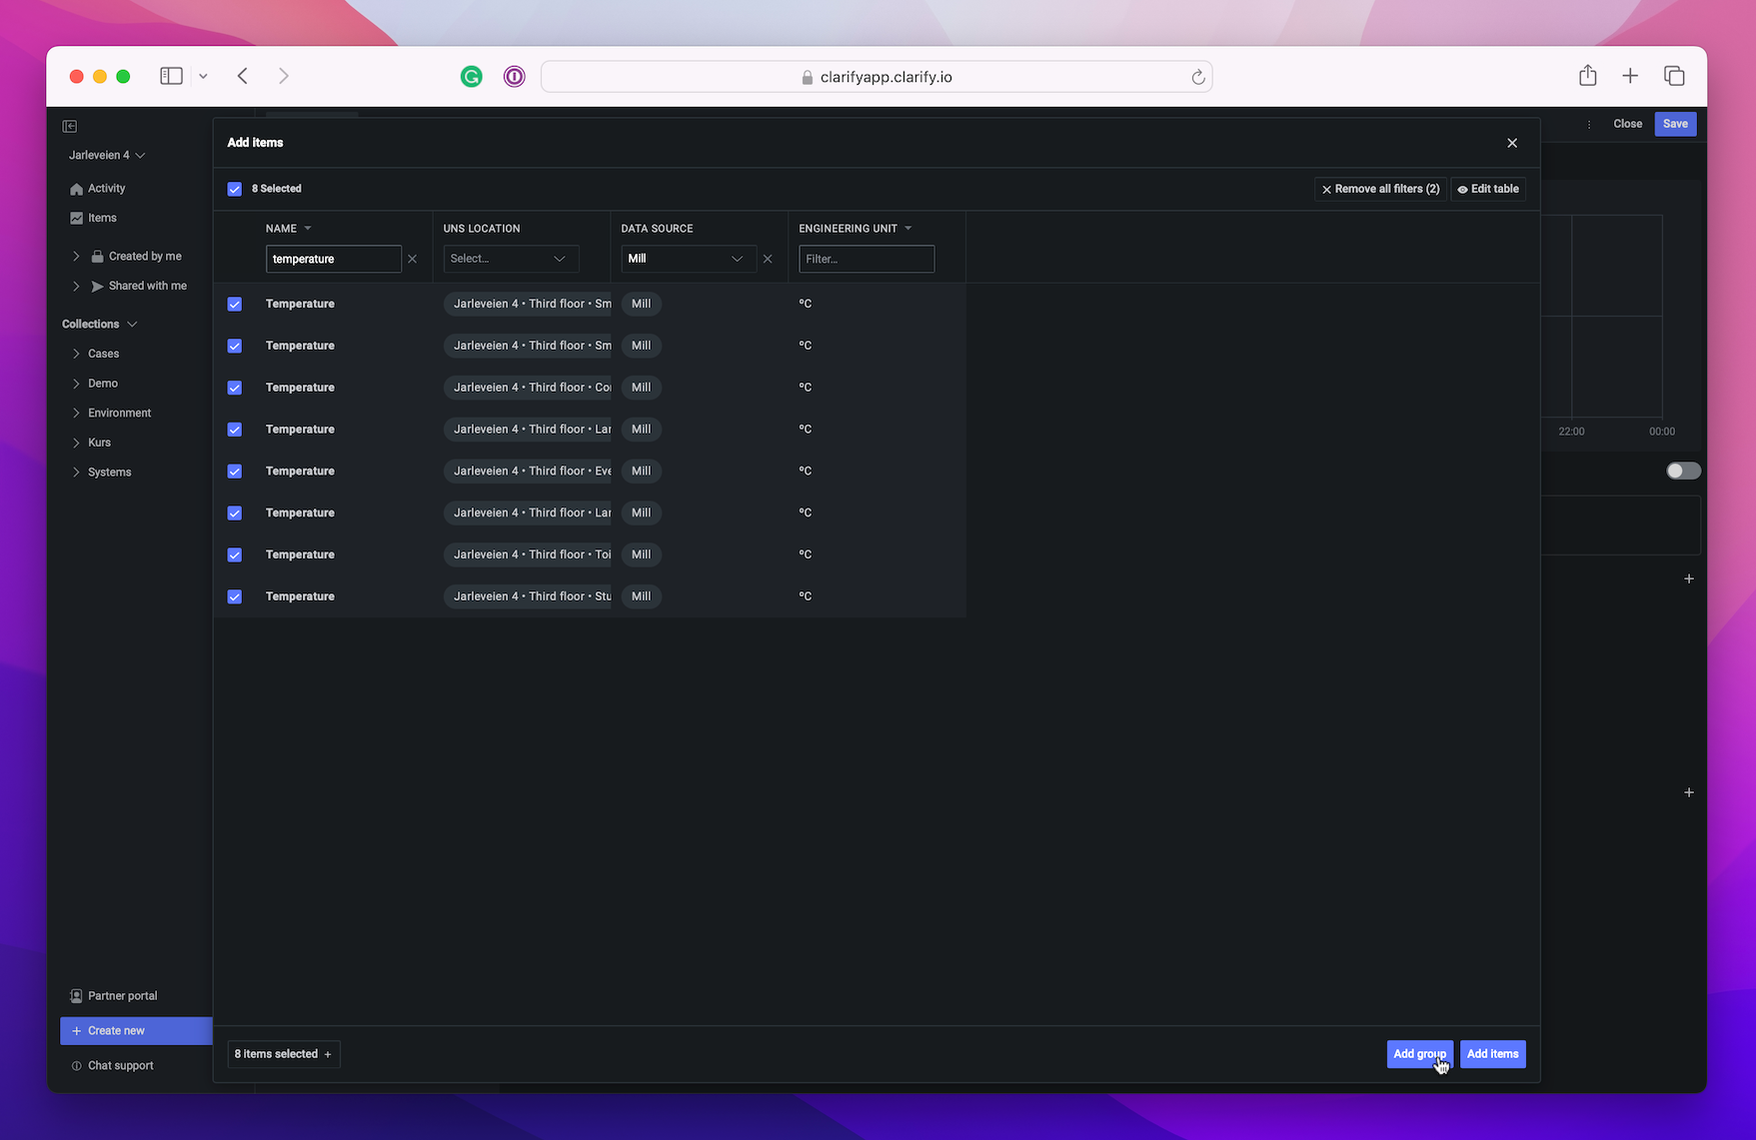
To be able to use a group you need to enable "Aggregated data", if it isn't set before you select the items you will get a pop-up that informs you that the aggregation need to be enabled.

In some cases this might be enough. The items selected could be filtered in the board and it would be easy to switch between the temperature in each room. But in our example we wish to showcase the difference between the outdoor and indoor temperature. To do this we need to add one more item that shows the outdoor temperature.
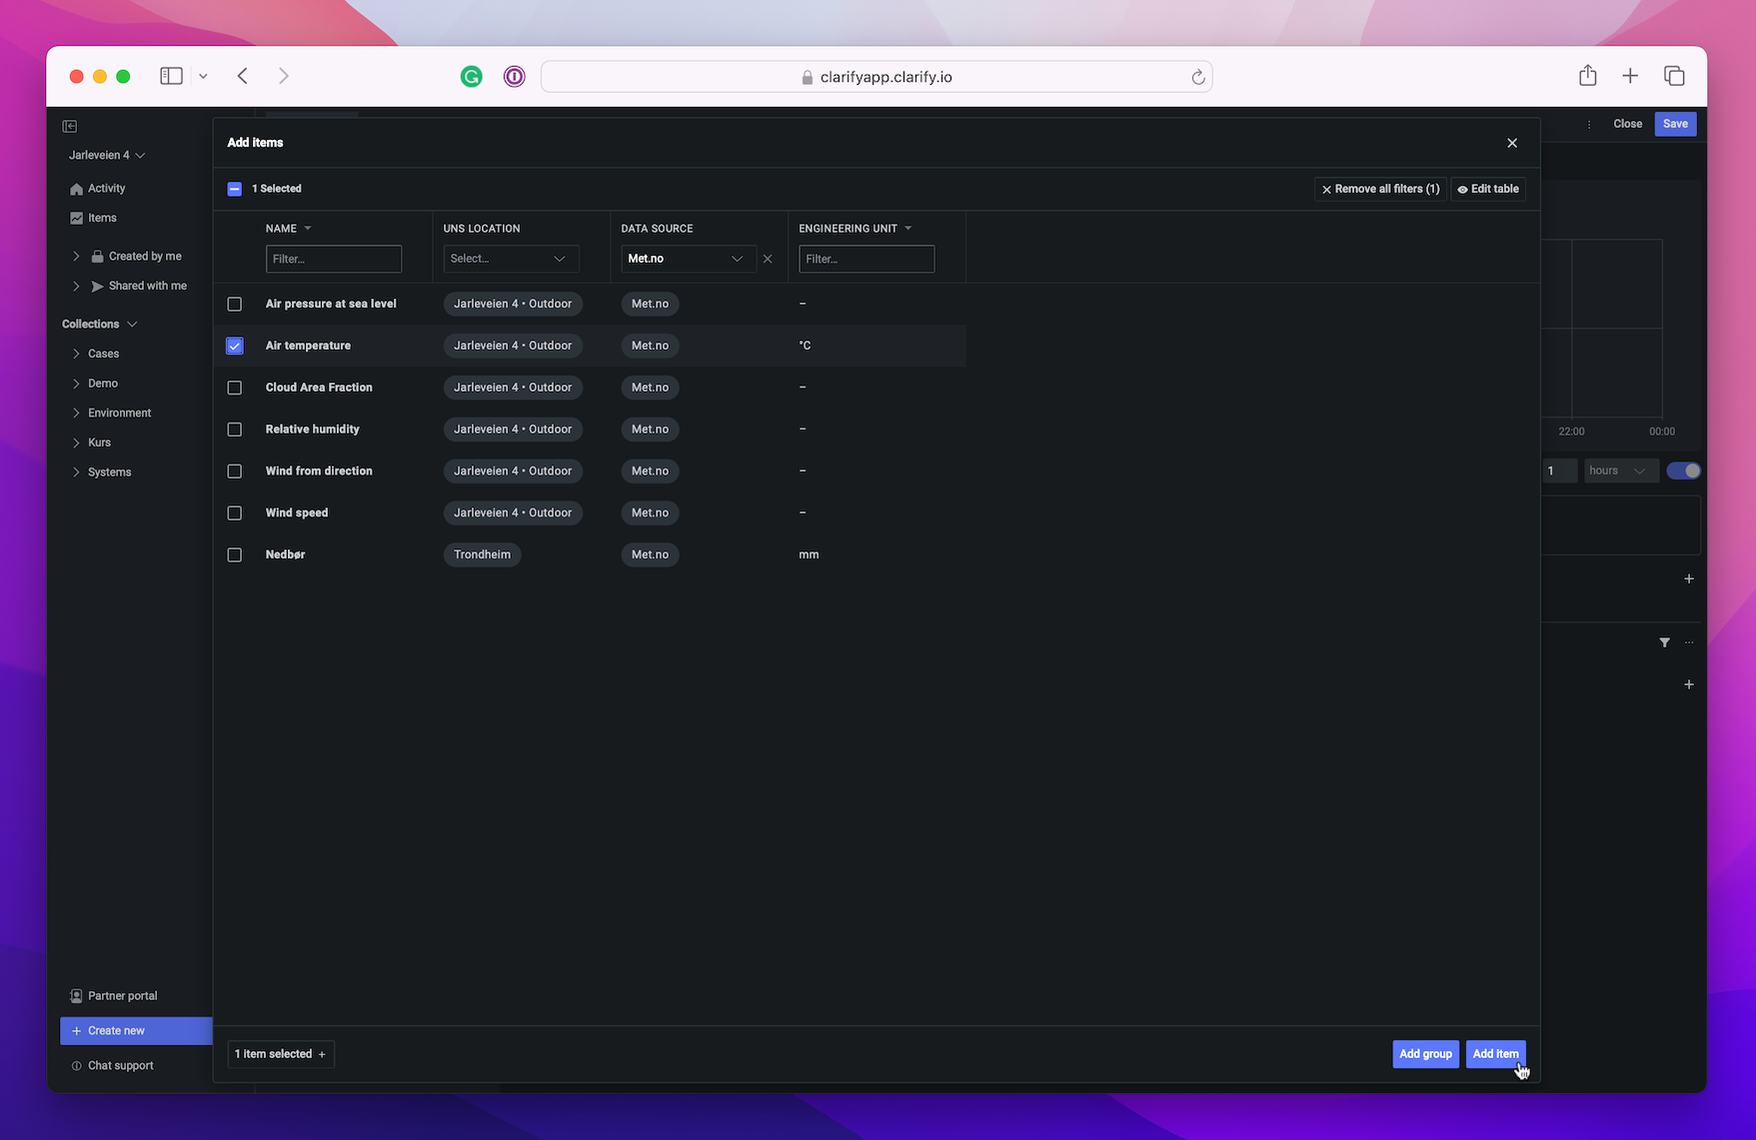
Since the outdoor temperature is the same for each room in our office, we don't need to add more then the one item, and we just press the "Add items".
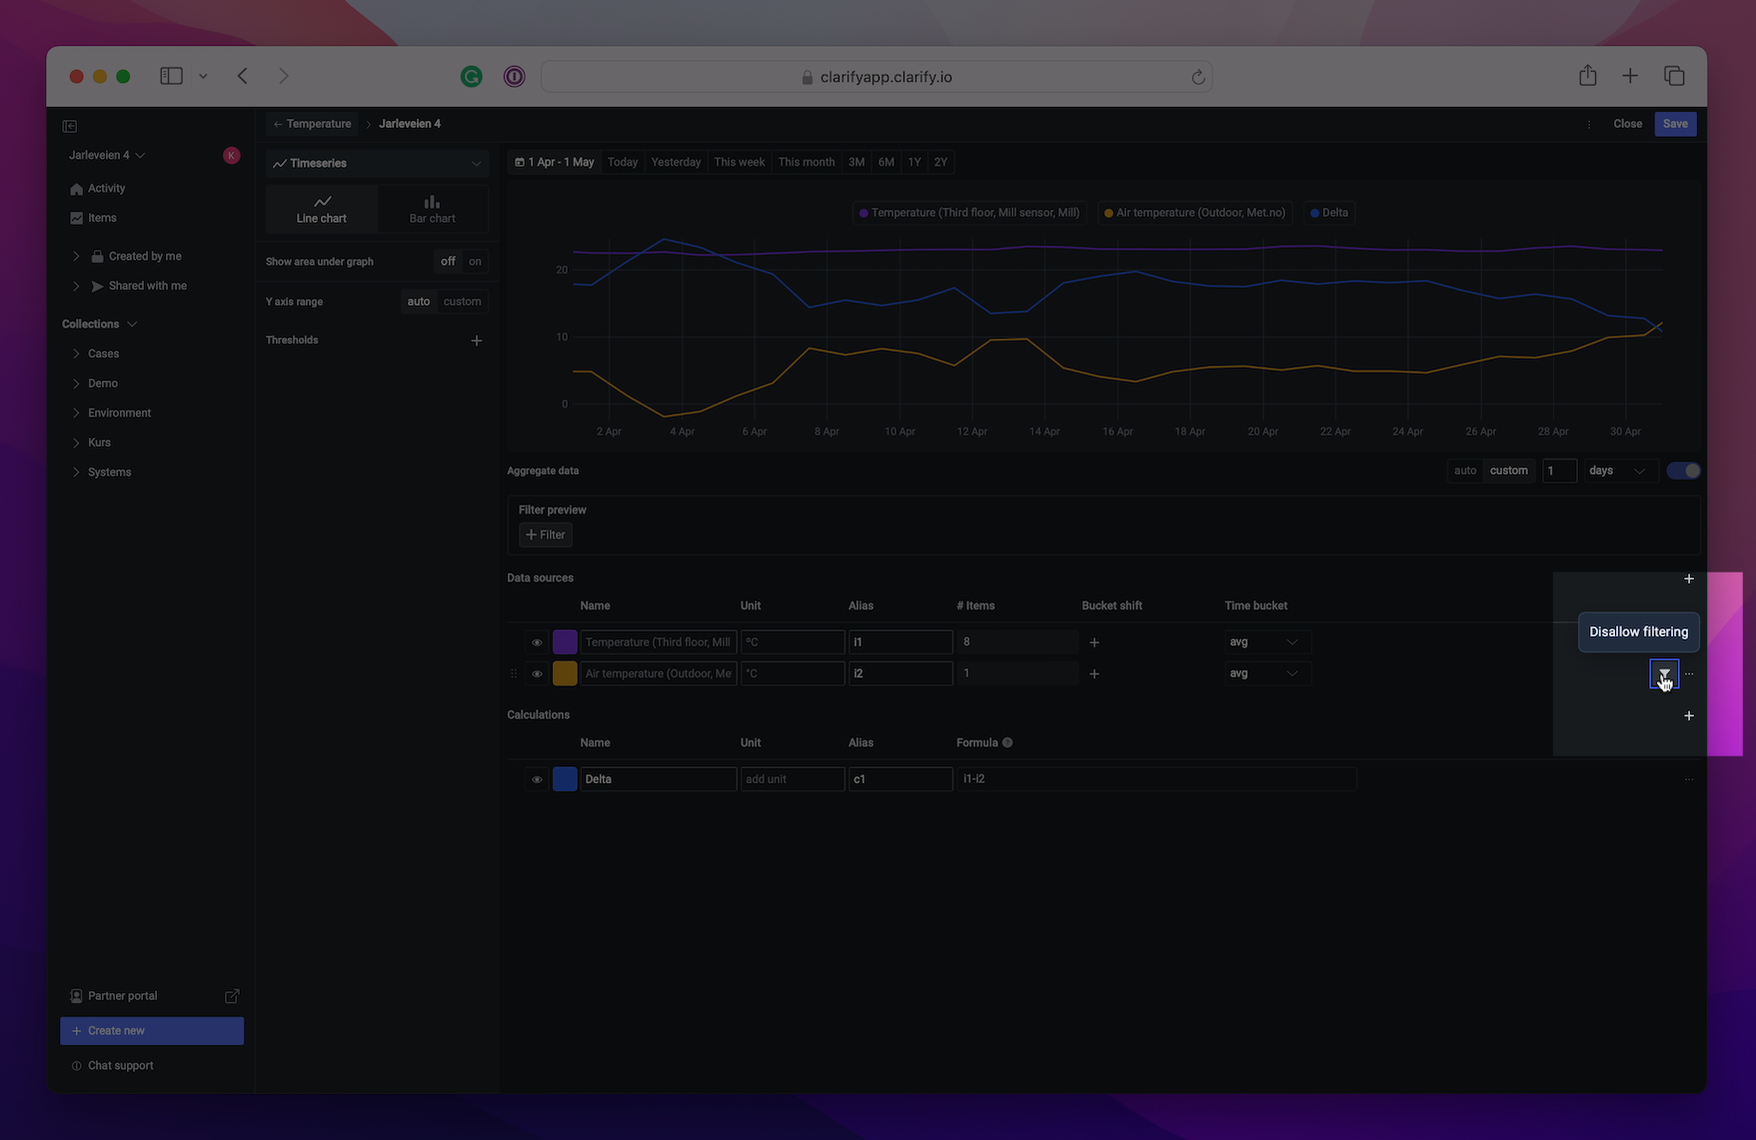
To find the difference between the outdoor temperature and the indoor temperature we need to create a calculation. In the calculation we use the alias for each item. As you can see the group of temperature items have the alias "i1", while the outside temperature has the alias "i2".

Before we save and go back to the board, we need to disallow filter from the outdoor temperature item. To be able to show the outside temperature alongside the temperature for each room, we need to disable the filter for this item, as it would be filtered out when we apply a filter for a room.
Create views
Save the visualization and go back to the board. Here you will see a button in the top right corner with the text "Create views", press it and then press the filter button on the left side.
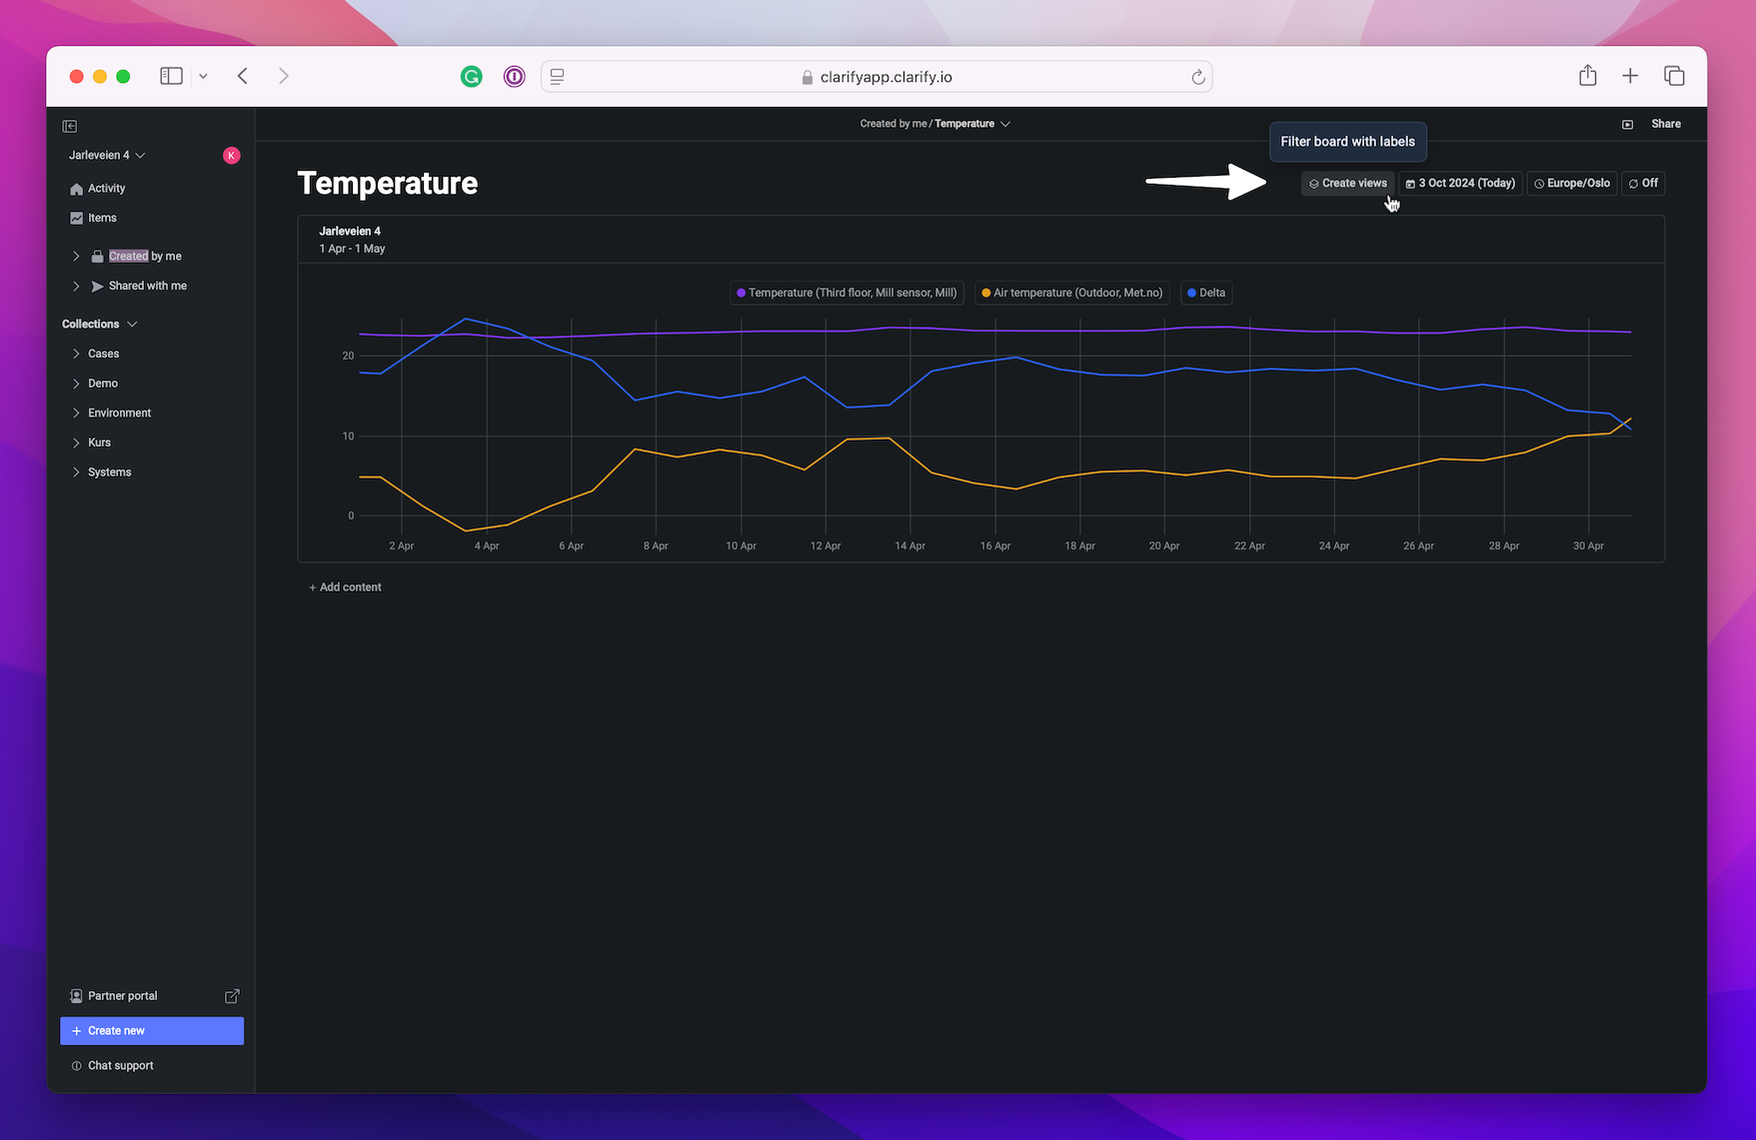

Add the filters you wish to use. Save the view by pressing the "Save view" on the right hand side, and give the view a name.
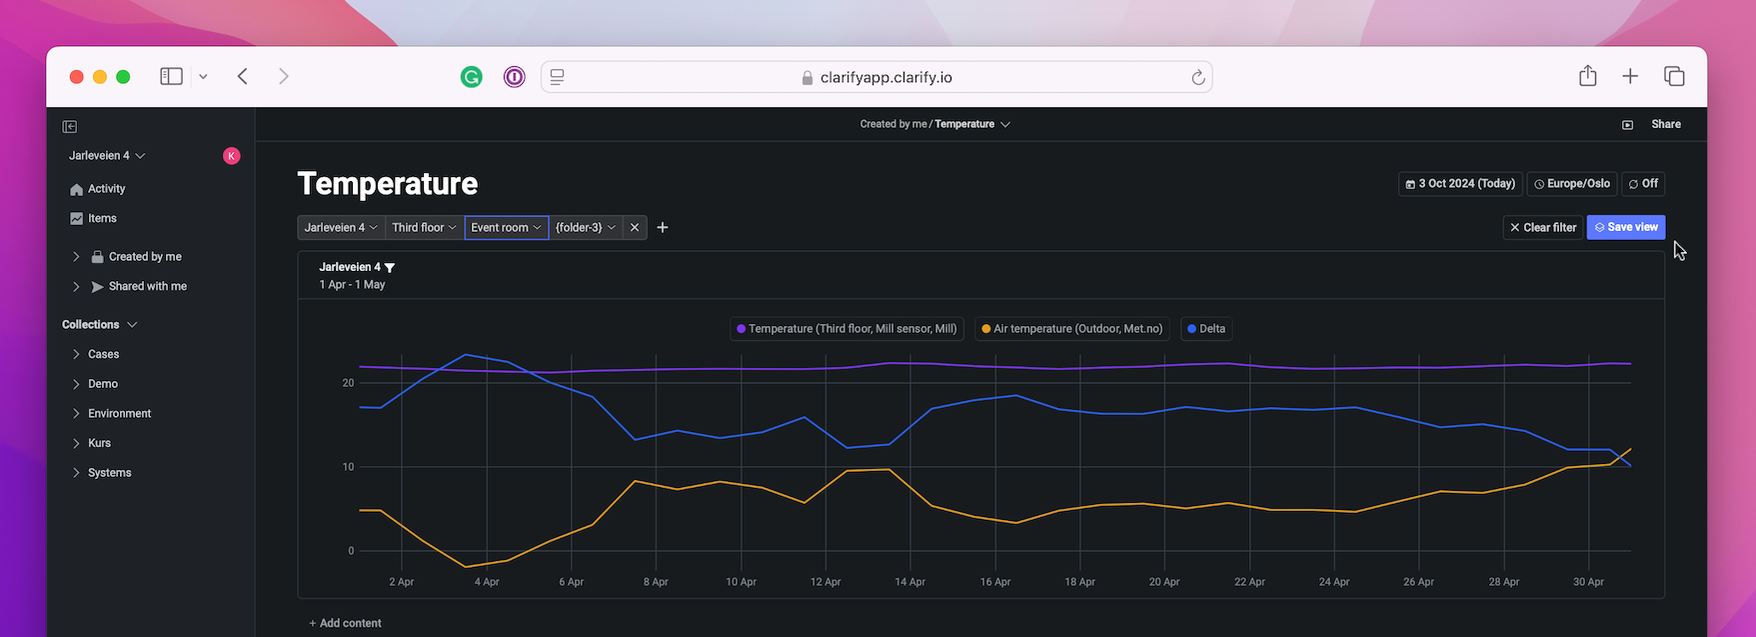

Now you've created your first board with one view! But we are not done yet. The main point with views is the ability to create multiple view in one board instead of multiple board with the same setup.
Create additional views
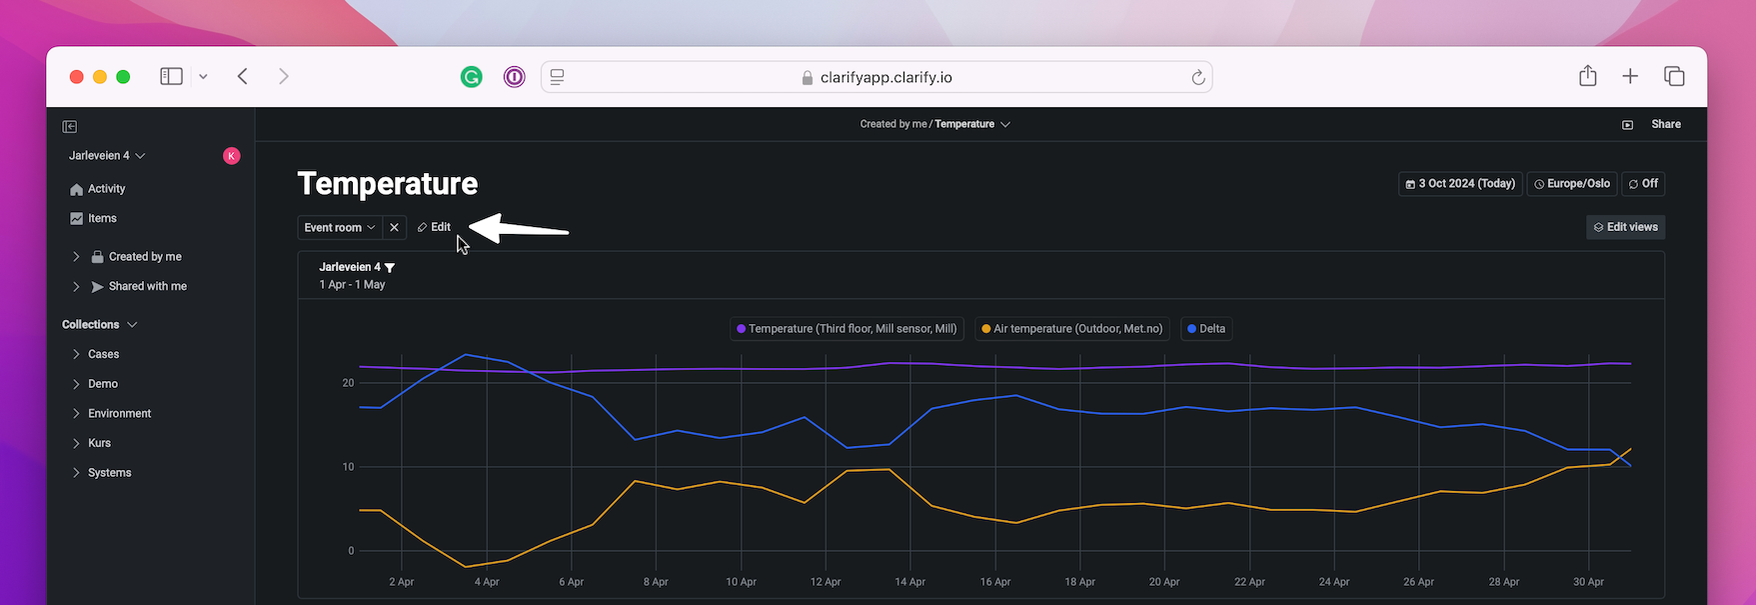
To create an additional view, just press the "Edit"-button right next to the view name and start changing the filter.
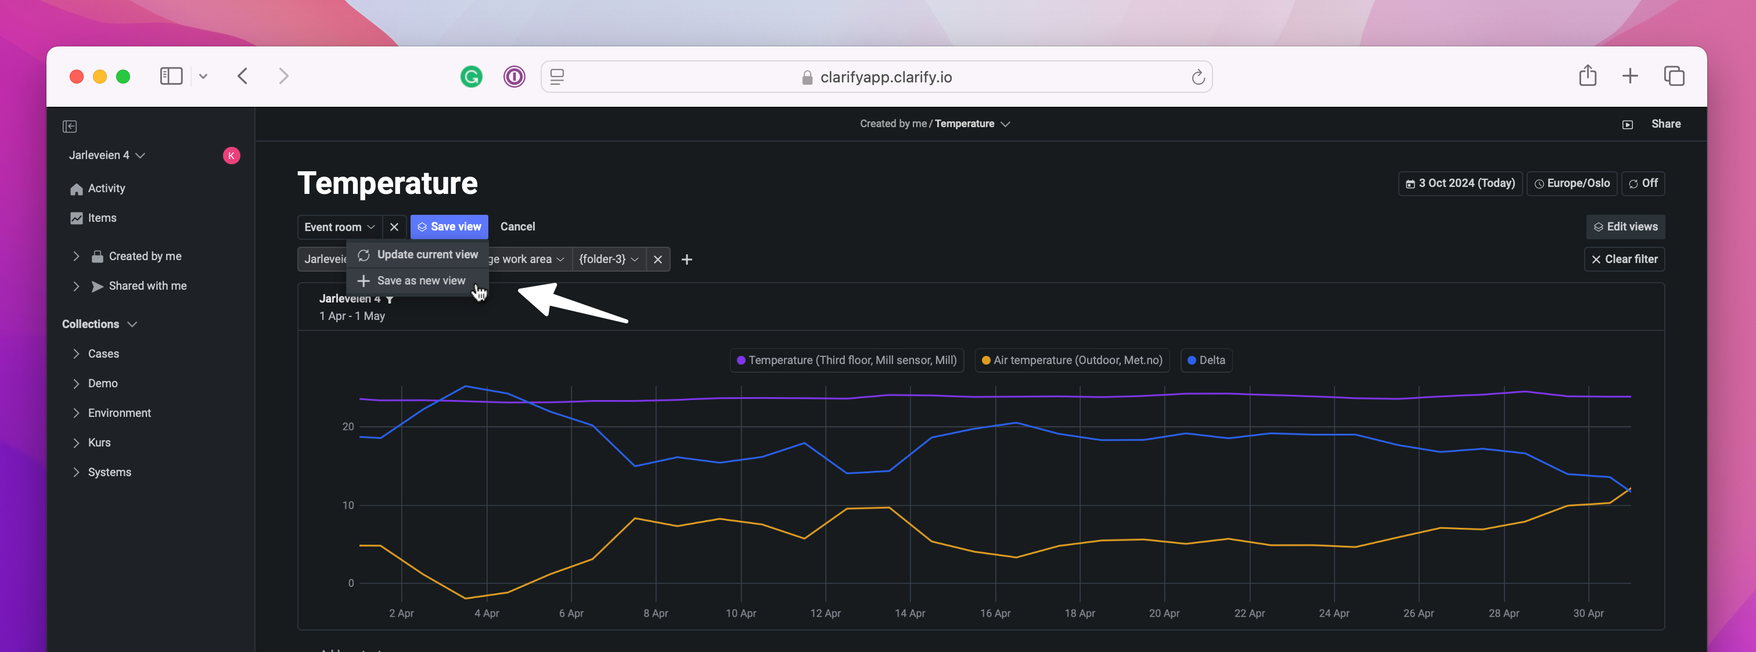
When the new filter is ready, save view and select "Save as new view". Then you will be able to create a new name for the view and it will be added to the list of views.
Open the view list to see all views that has been made.

Multiple tags in one view
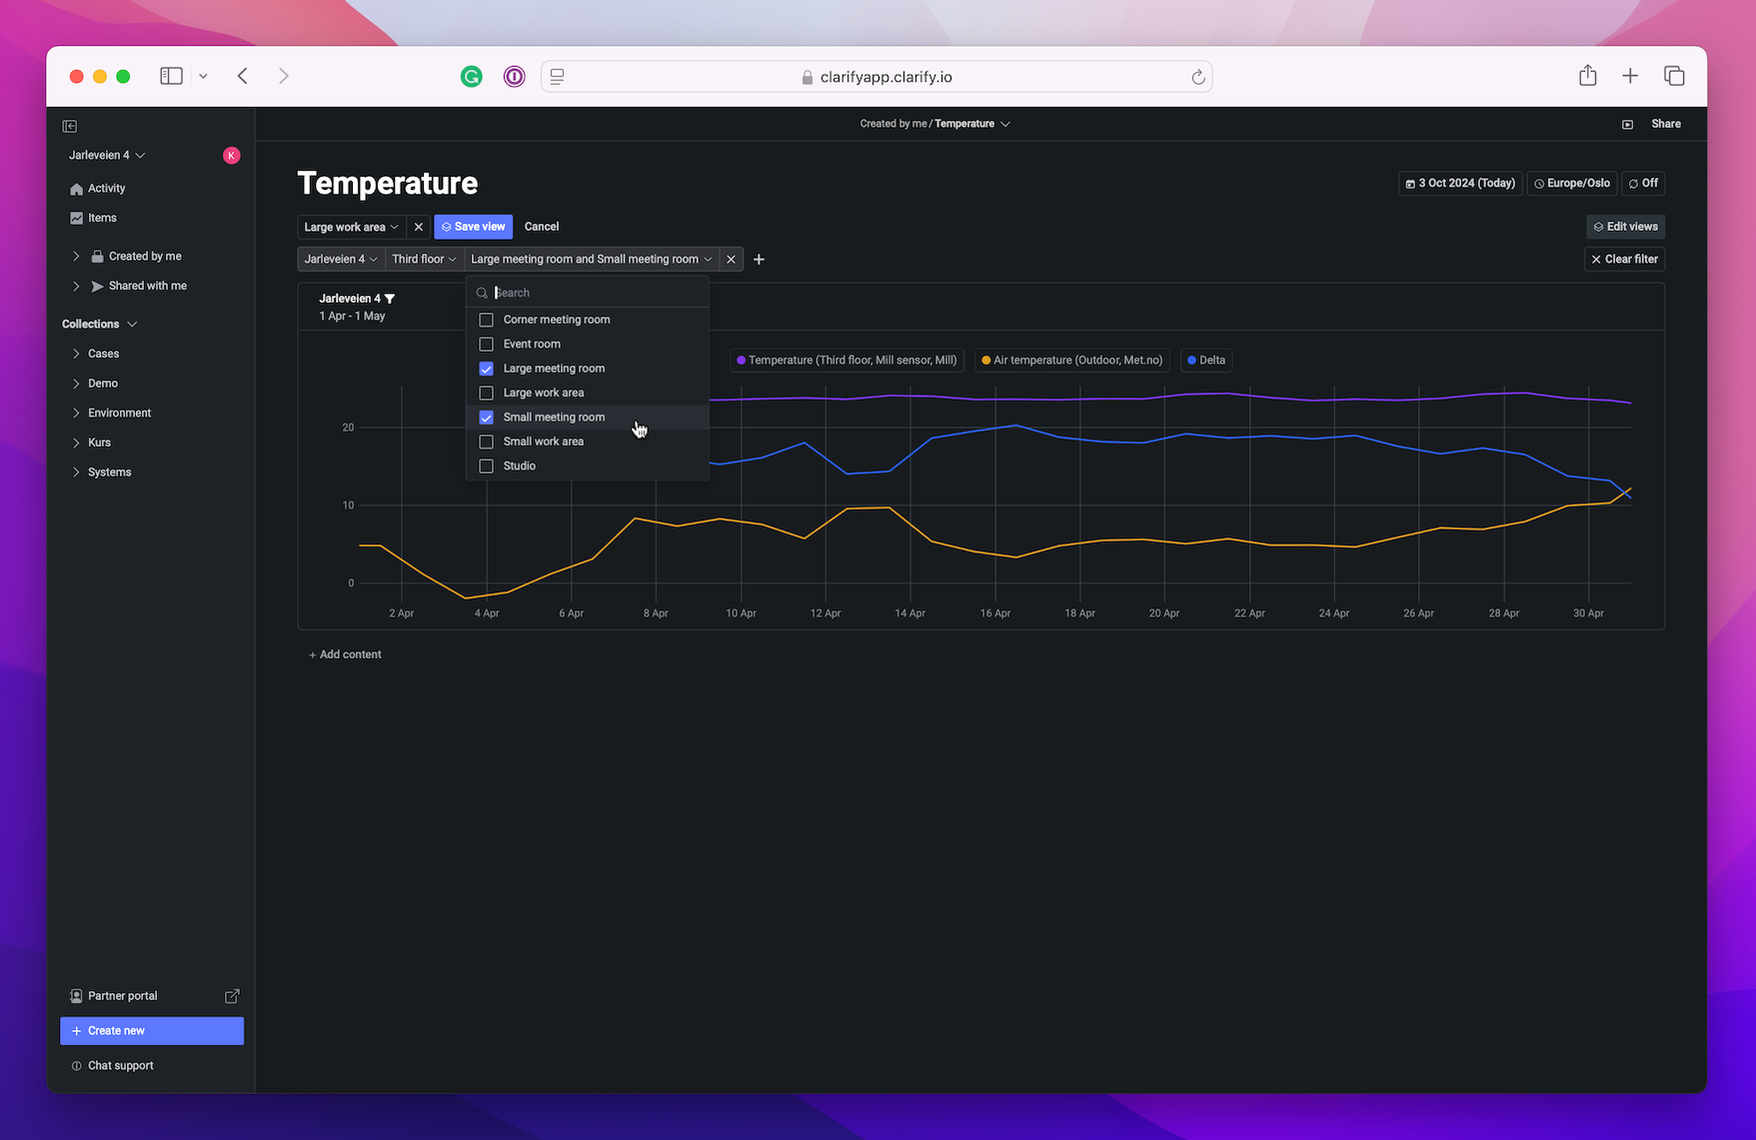
It is also possible to add multiple tags in one view. Lets look at our example, we wish to see the average temperature of our small meeting room and our large meeting room compared to the outdoor temperature. To do this we create a new view and simply select both the large and small meeting room tags.
