Calculations in board
Have you ever needed to combine two items to get the result you want? It is now easily done with calculation in boards. When creating a visualization just add all the items you want and do a calculation on the ones you need. Lets go through it step by step.
First open a board and create a visualization, in our case we want to have a line chart showing the cost of todays power usage in our office. Press the "+" button on the line where it says "Calculation". Calculations can only be performed on aggregated data, and if you haven't already switched to aggregation you will get a pop-up telling you to do so.
Each item has an auto generated alias to be used in a calculation. In our case the "price"-item has the alias "i1", and "power"-item has the alias "i2".
We want to multiply the price with the power usage with the calculation "i1*i2" to calculate the value correctly and give it the name "Cost".
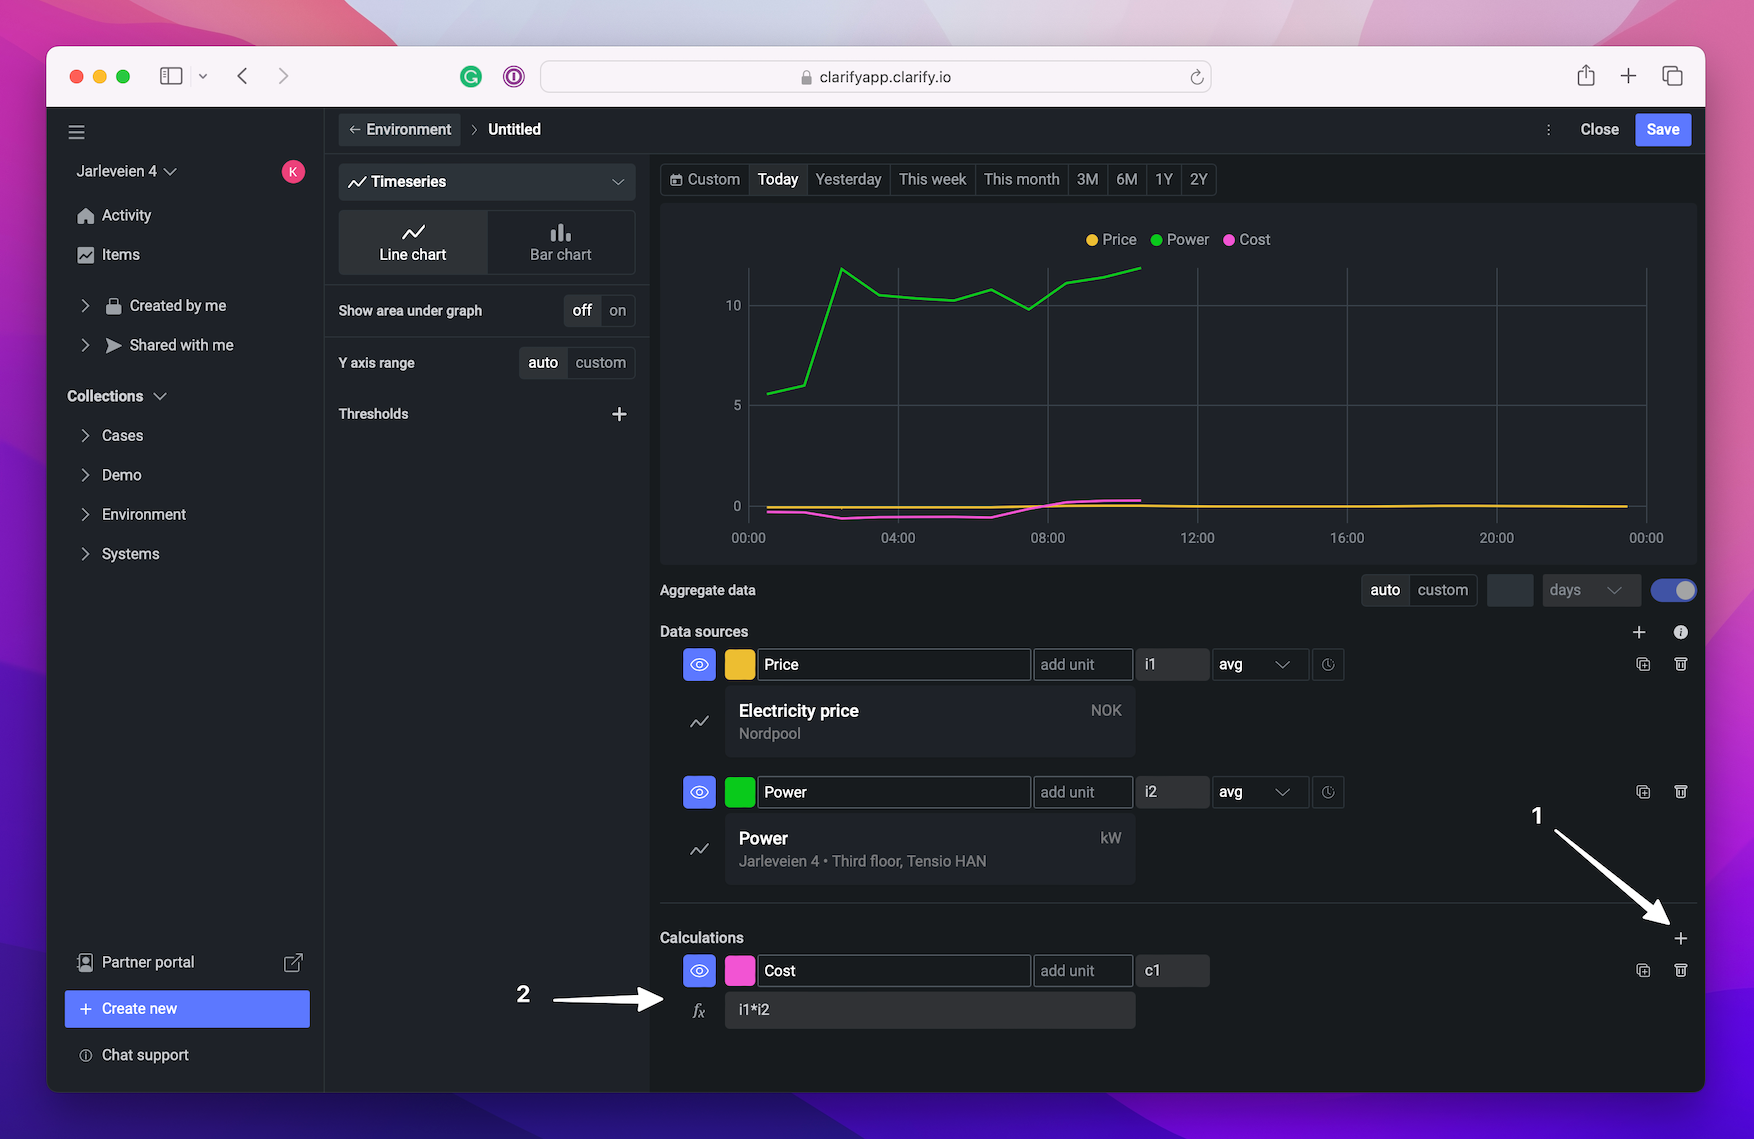
Now there is a graph with the cost of the electricity, bucket for bucket. We did not specify the bucket size of the aggregated data, but we now want to improve our visualization and calculation and get the cost for each 15 minute bucket. To do this we start by changing the aggregation from "auto" to "custom: 15 minutes", this means the data is aggregated into 15 minute buckets. We can also make the calculation easier to read, by replacing the automatic alias for the data sources, from "i1" to "price" and "i2" to "power". After doing this, we can update our calculation to be "price*power".
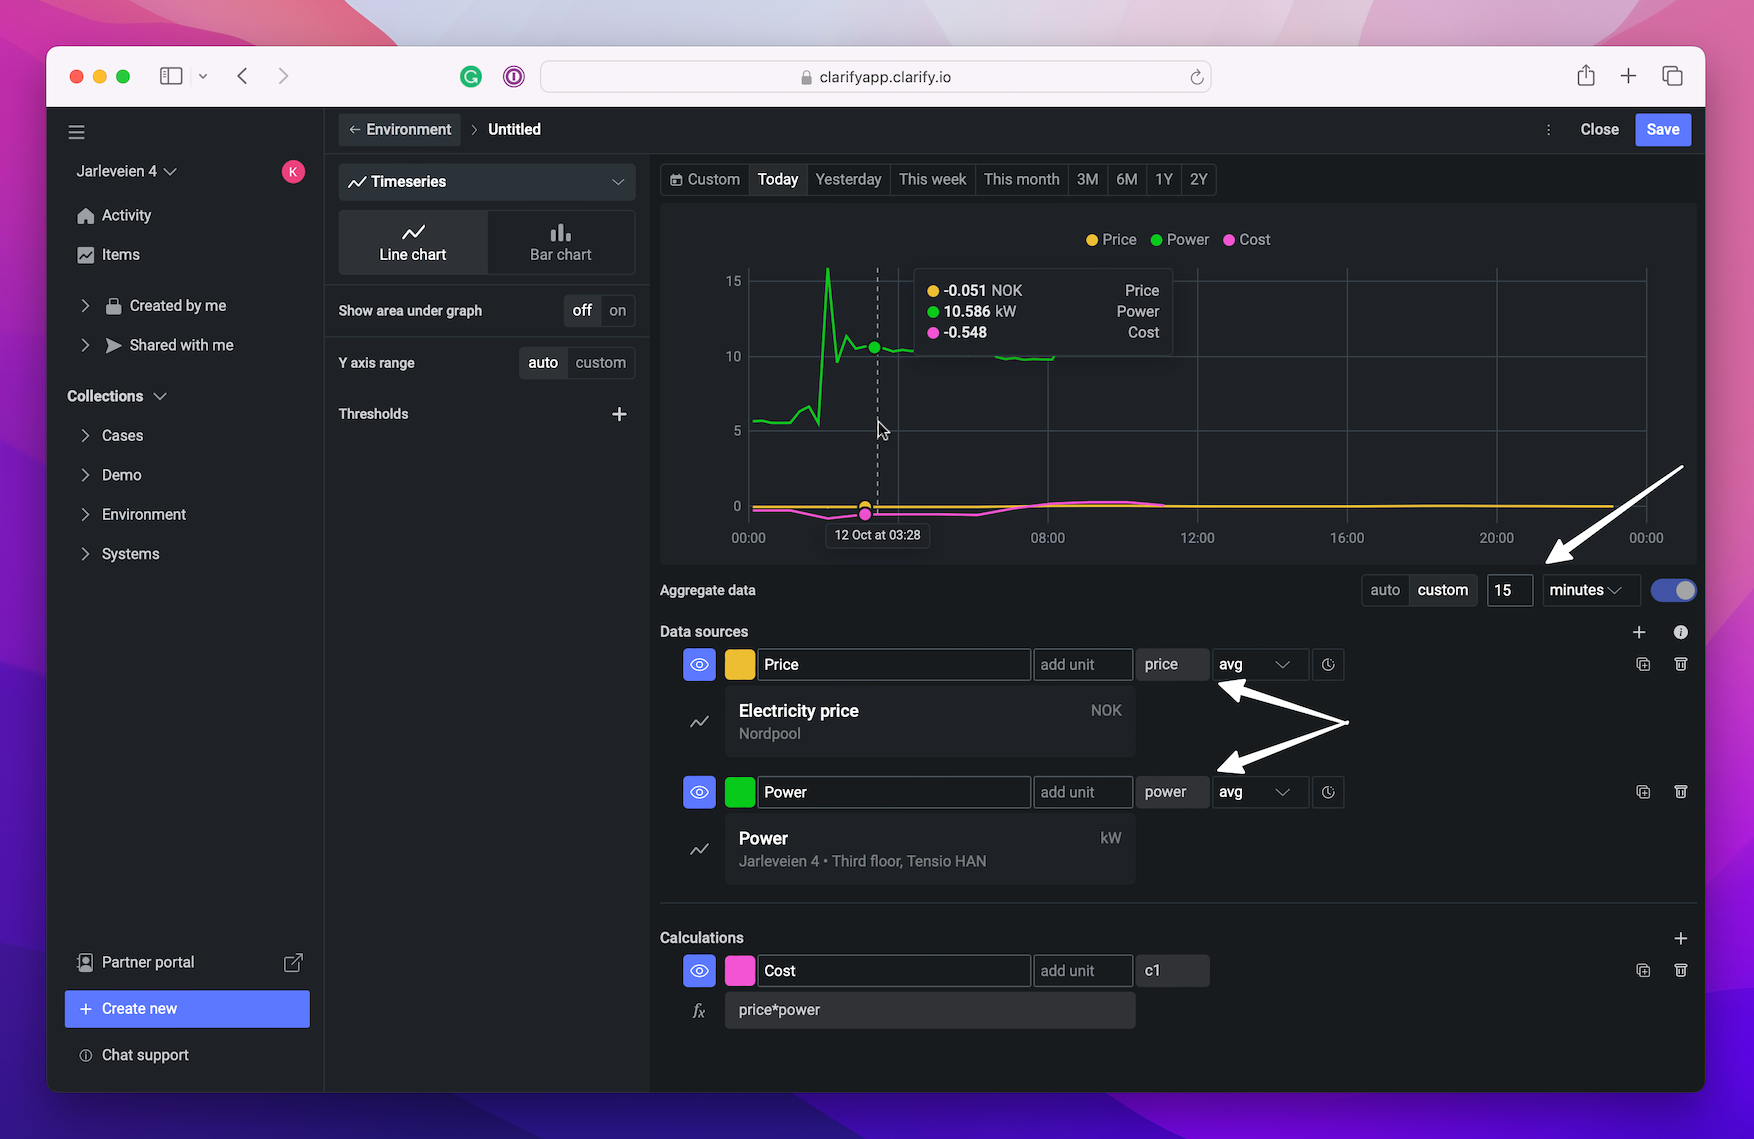
Now the values of our two data sources does not align for all the buckets! The value for power exists in every 15 minute bucket, while price is only defined once per hour, and our calculation will only calculate buckets that contain values for all the variables. We can fix this by changing our calculation to use gapfill. This will use the previous value of the gap-filled item in the calculation when the item does not have a value. So in our case we need to change the calculation to "power*gapfill(price)" to get the calculation for each 15 minute bucket.
To make the data more readable we can change the unit of the calculation to our currency which is NOK in this case.
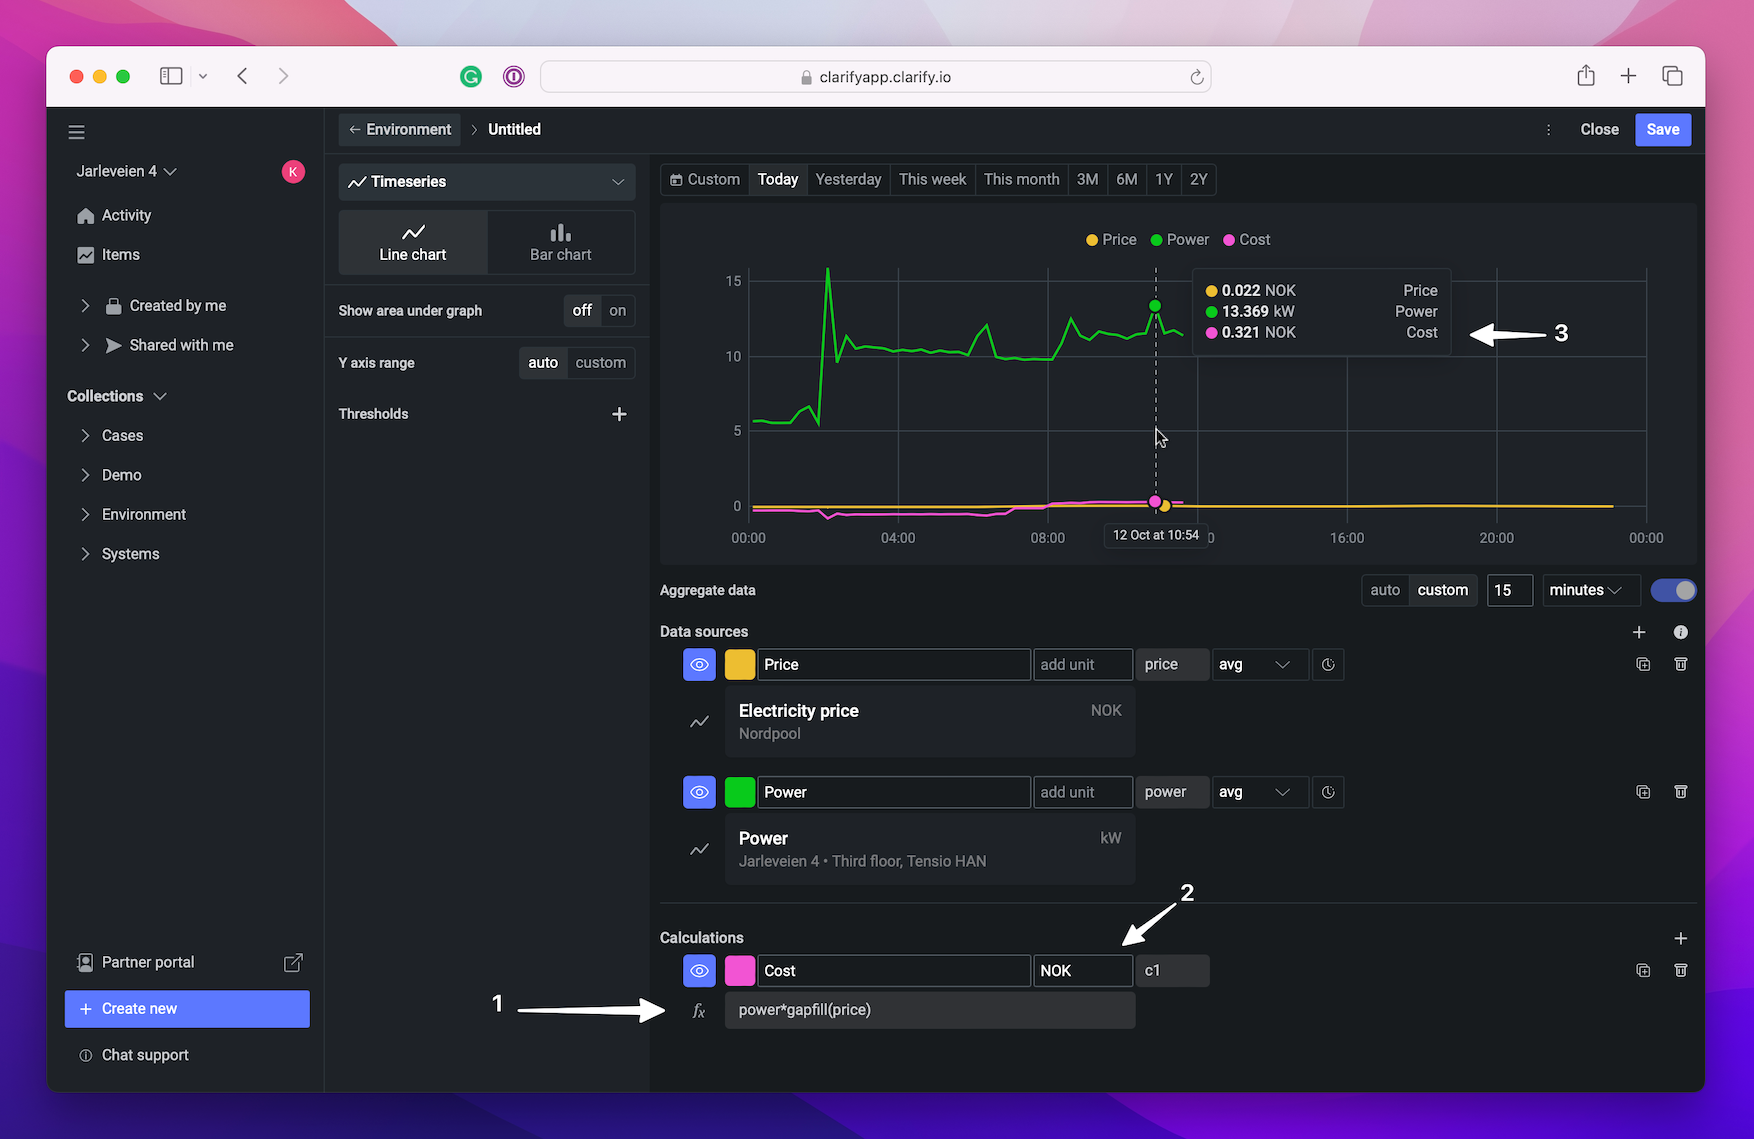
Create calculation
Writing a calculation can be done in two different ways. Either write each alias and formula by hand or select the correct ones from a list of all alias and formulas.
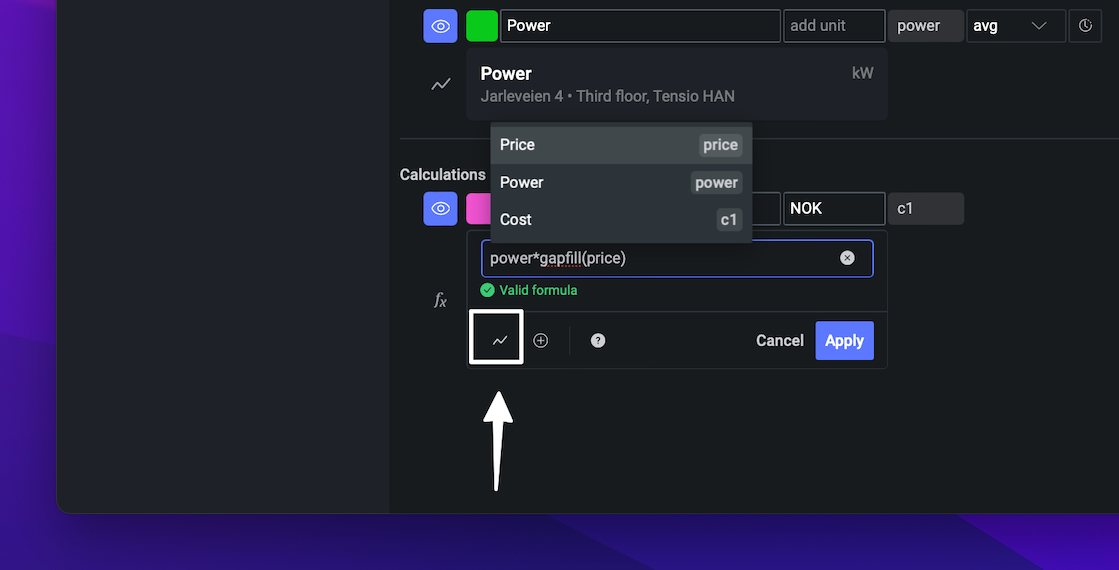
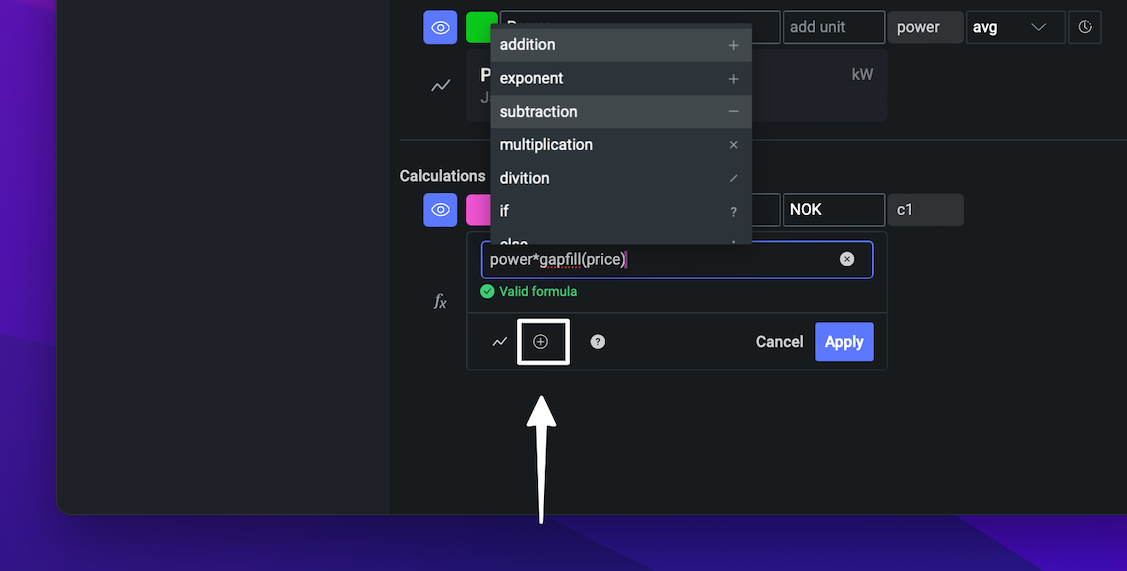
Explore different calculation options by opening the formula-menu.
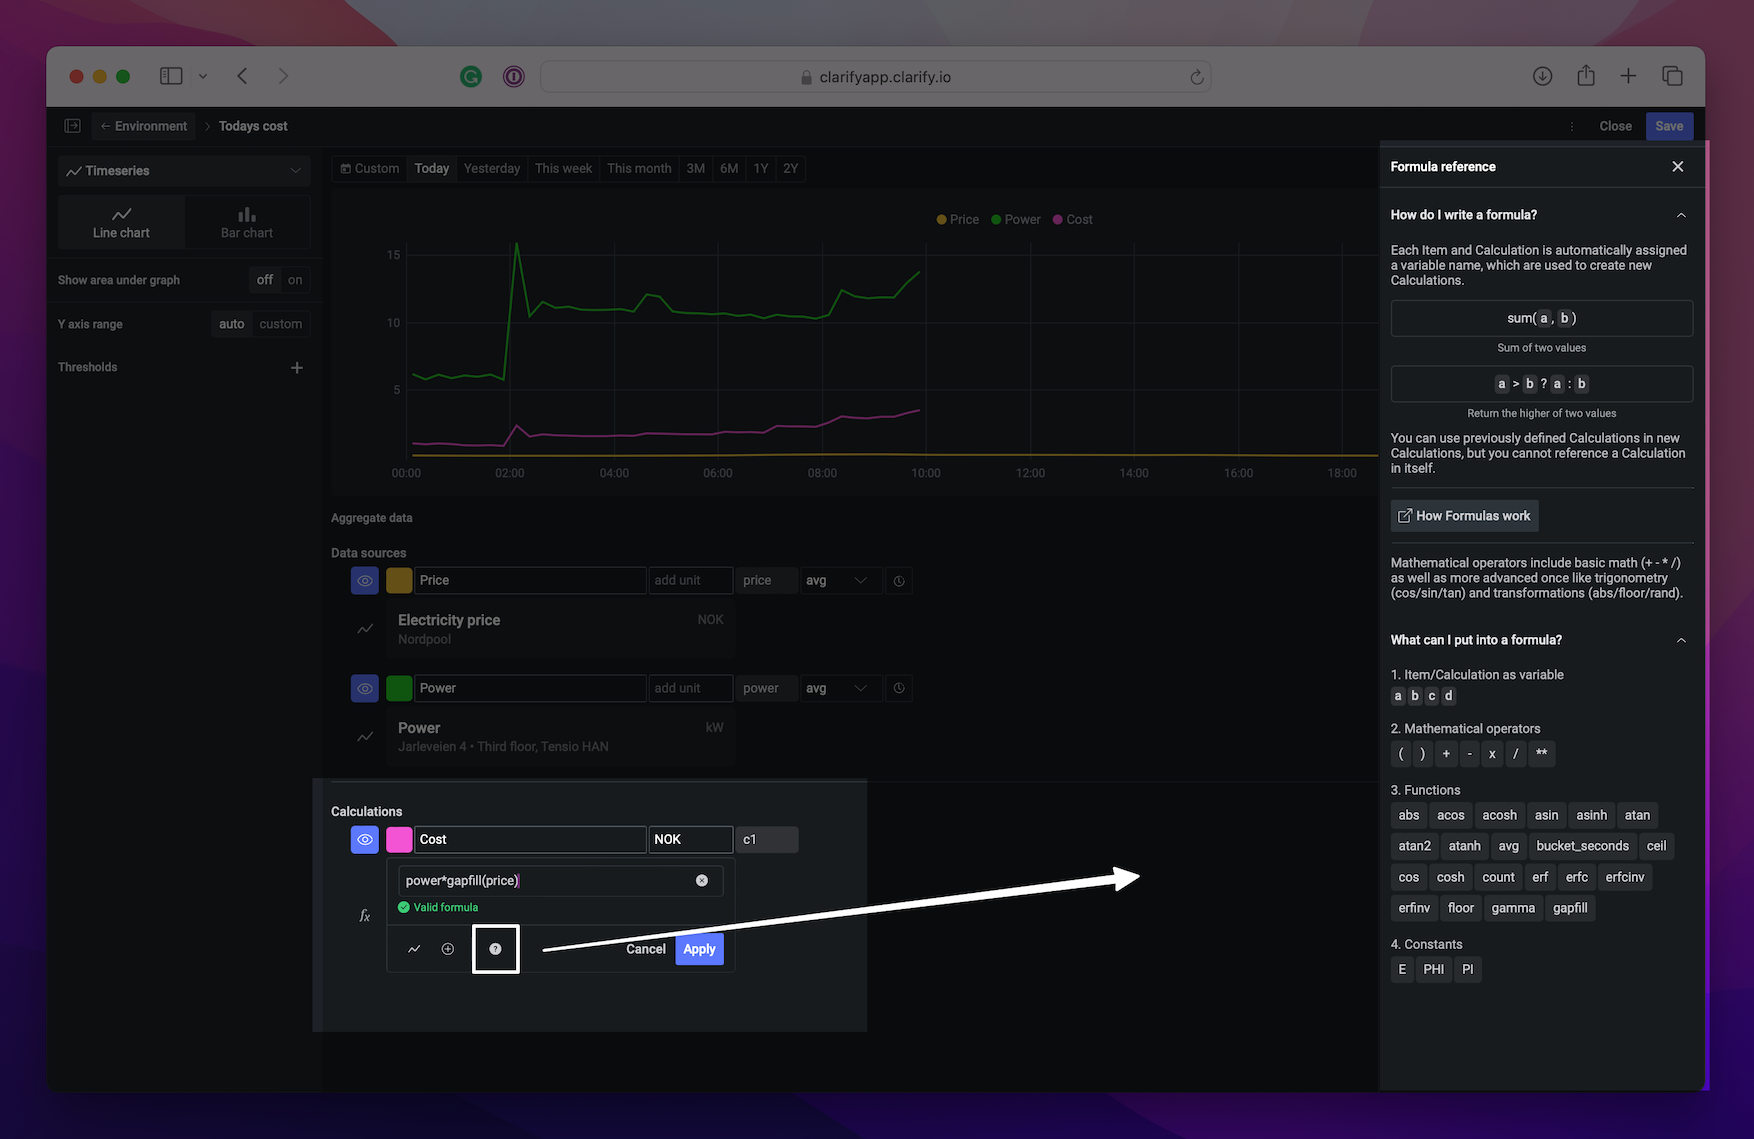
Time-shift and calculation
It is also possible to time-shift items and use the outcome in a calculation. To show this we want to create a new visualization where we compare what our electricity usage would cost with todays price and last years price. We open a new bar chart visualization where we add one item with the power value and two items with the same price value, setting the aggregation to 1 day and the time frame to "This month". Then we select one of the price items and time-shift it by pressing the watch-icon on the right. The item can be time-shifted into the future and past, and in this case we set the value 365 days ago to get last years price.
Now it's time for calculations, and since we want to show the current cost and what it could have been with last years price we need two calculations. The two calculations uses the item with alias "power" (current power usage) times "lastYearPrice" and "priceToday". To make it easier to compare the cost we hide all the items in the data source, only plotting the newly calculated items.

Partial results
Sometimes it can be useful to create calculations based on other calculations' result. This is possible in our system as well. You can use the results from one calculation as input to another calculation just as you use items by referring to it's alias. Just use the alias of the calculation (either the auto generated one or you could change it as with items) in a new calculation.
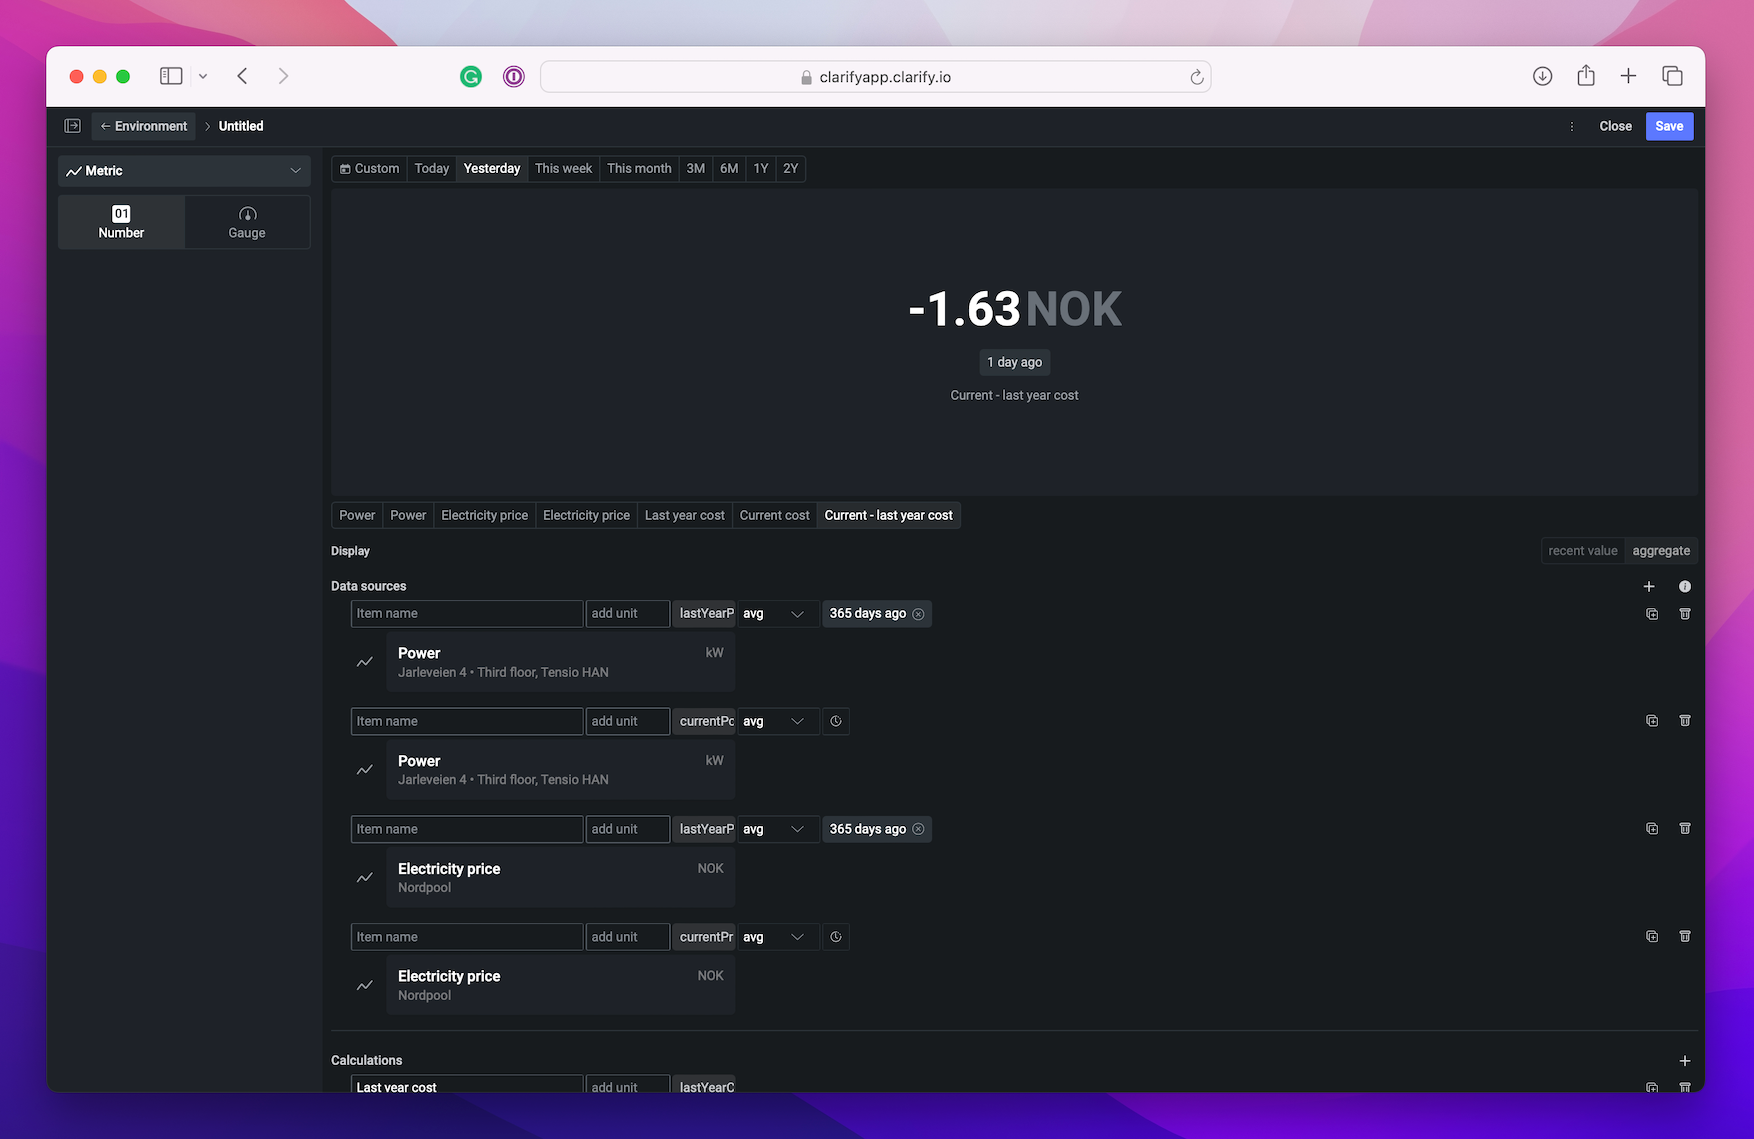
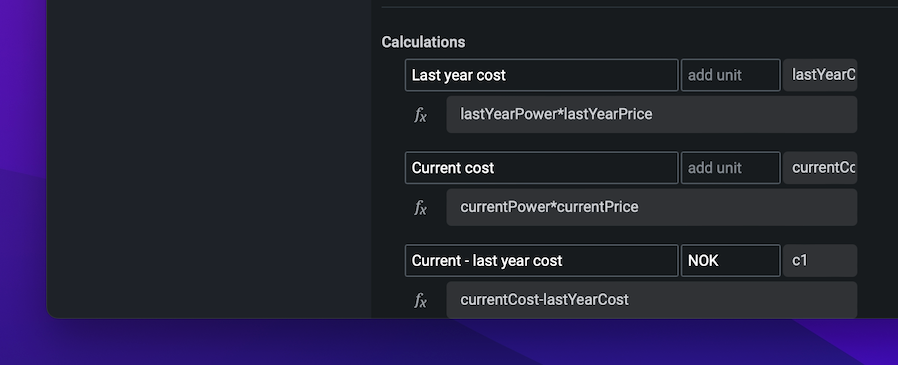
Let look at an example of this. We wish to have the difference in prices on what electricity cost today vs. electricity price last year, and we just want yesterdays price difference in a single number.
So we create a metric visualization with the power and price items we need, duplicate them so we have two of each and time-shift one power and one price item to 365 days ago.
Calculations in board compared to calculated items
Calculations in boards are more powerful than calculated items in a few ways:
- It evaluates all buckets in the time window, even when none of the input items contain data.
- It allows gapfilling.
- It allows using different aggregations for different input items.
- It allows time-lags.
- It allows multiple results.
- It allows partial results (using the result of a calculation as input to a later calculation).
- It allows calculations without input items (e.g. sin(time_seconds/3600*PI)).
- It allows functions with results that are time-independent (e.g. 1+1 or 42).
The following functions are only available in calculations in boards:
- bucket_seconds() / bucket_seconds
- gapfill(x)